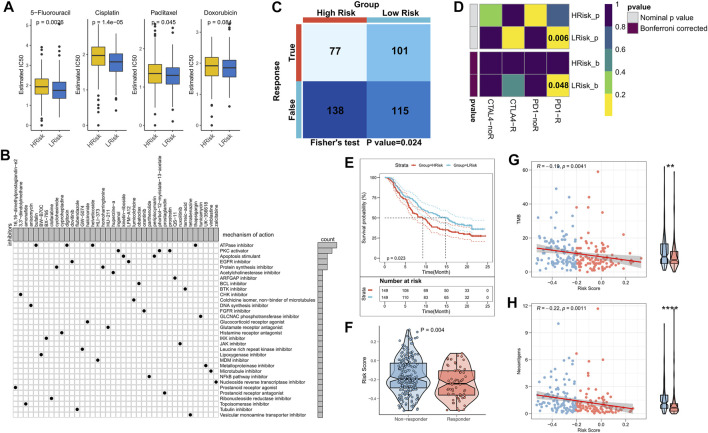
FIGURE 7.
Role of the NRG-related risk model in guiding clinical treatment and decision-making. (A). Box plot showing predicted IC50 values for four commonly used drugs in the high-risk and low-risk groups; (B). Oncoplot showing the small molecule compounds, wherein the horizontal axis represents the name of the small molecule inhibitor and the vertical axis represents the biological pathway targeted by the corresponding small molecule inhibitor; (C). TIDE algorithm for predicting responses to immunotherapy between the high-risk and low-risk groups; (D). Subclass mapping for predicting sensitivity to PD1 and CTLA4 treatment in patients belonging to the high-risk and low-risk groups; (E). KM survival curves for the high-risk and low-risk groups in the IMvigor 210 cohort; (F). Box plot showing the differences in RiskScore between patients in the treatment-responsive and non-responsive groups of the IMvigor 210 cohort; (G). Correlation between RiskScore and TMB in the IMvigor210 cohort; (H). Correlation between RiskScore and neoantigens in the IMvigor 210 cohort.

