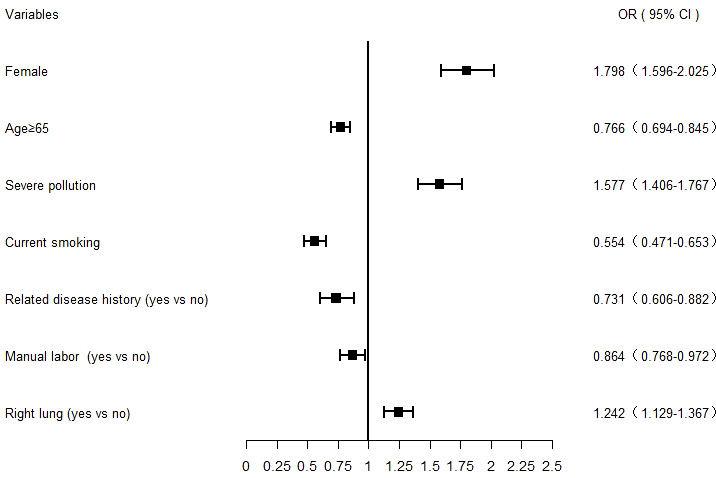
Figure 1.

Forest plot of lung adenocarcinoma risk factors analyzed using a multivariate logistic regression model. The squares and bars represent the odds ratio (OR) with a 95% confidence interval (CI).

Forest plot of lung adenocarcinoma risk factors analyzed using a multivariate logistic regression model. The squares and bars represent the odds ratio (OR) with a 95% confidence interval (CI).