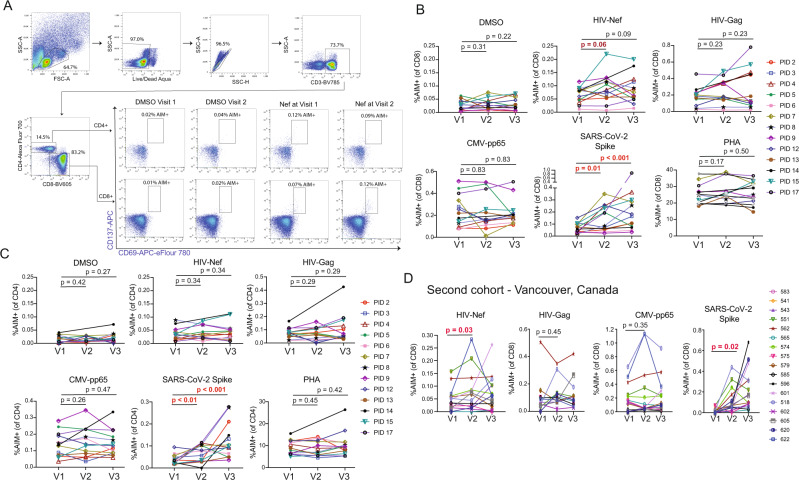
Fig. 3. Sustained increases in SARS-CoV-2-specific CD4+ and CD8+ T-cell responses and transient increases in HIV Nef-specific CD8 T-cells following COVID mRNA vaccination.
A Representative gating schematic for TCR-dependent activation induced marker (AIM) + populations (CD69+ CD137+) after stimulation with HIV, SARS-CoV-2 or CMV gene products. B, C Combined AIM + CD8+ and CD4+ T-cells results for n = 13 ARV-treated donors at baseline (V1), and ∼2 weeks after vaccine dose 1 (V2) or vaccine dose 2 (V3). CD8 + - B, CD4 + - C Data points represent means of duplicates. All responses are background (DMSO) subtracted, with the exception of the DMSO condition, which is shown as a mean of raw values. P values were calculated by one-tailed Wilcoxon matched-pairs signed rank test, adjusted for multiple comparisons using the Holm method. For the following comparisons where P values are given as <0.1 or <0.01 the exact p values are: SARS-CoV-2 Spike CD8 between V1 and V3 P = 0.0005, SARS-CoV-2 Spike CD4 between V1 and V2 P = 0.0093, between V1 and V3 P = 0.0007. D Results are analogous to panel B, but performed on a confirmatory cohort from Vancouver, Canada. P values were calculated by two-tailed Wilcoxon matched-pairs signed rank test, without multiple testing adjustments. Source data are provided as a Source Data file.

