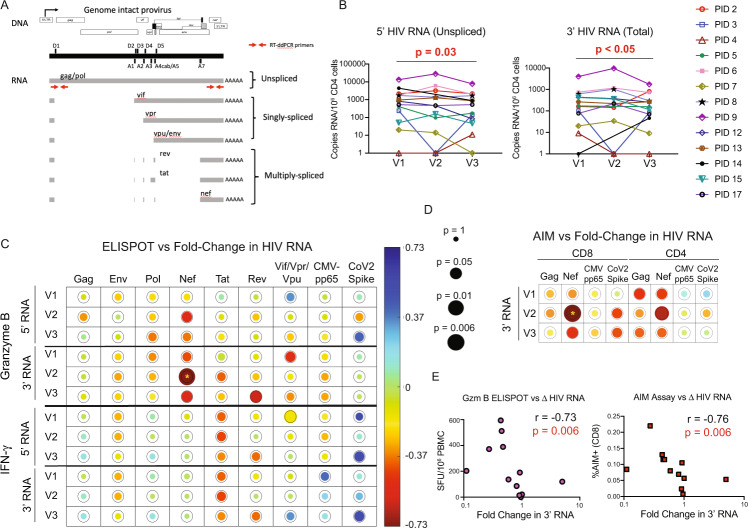
Fig. 5. Cell-associated HIV RNA decreased across SARS-CoV-2 mRNA vaccination, in inversely correlating with Gzm-B T-cell responses to early gene products.
A Positions of RT-qPCR primer/probes. The 3’ primer/probes target all unspliced and spliced isoforms of HIV poly(A) RNA, whereas the 5’ primer/probes only target unspliced. B Cell-associated HIV RNA for n = 13 ART-treated donors at baseline (V1), and ∼2 weeks after vaccine dose 1 (V2) or vaccine dose 2 (V3). P values were calculated by one-tailed Wilcoxon matched-pairs signed rank tests, comparing V1 to V3, without adjustments for multiple testing. C, D Depiction of Spearman correlations between proportional changes (V3/V1) in HIV RNA and magnitudes of indicated T-cell responses measured at indicated visits by ELISPOT (C) or AIM assay (D). Circle sizes are proportional to P values, and color to Spearman’s R, as indicated in the scales shown. Analyses are for the n = 12 individuals who completed all 3 visits (donor 14 missed V2). The rings around each circle indicate the threshold P value of 0.05. Yellow asterisks indicate correlations that were significant following correction post hoc for multiple comparisons by the false discovery rate method of Benjamini and Hochberg using the SAS MULTTEST procedure (FDR option) (see also Supplementary Tables 4 and 5). E Plots of the most significant correlations from C (left panel) and D (right panel). Source data are provided as a Source Data file.

