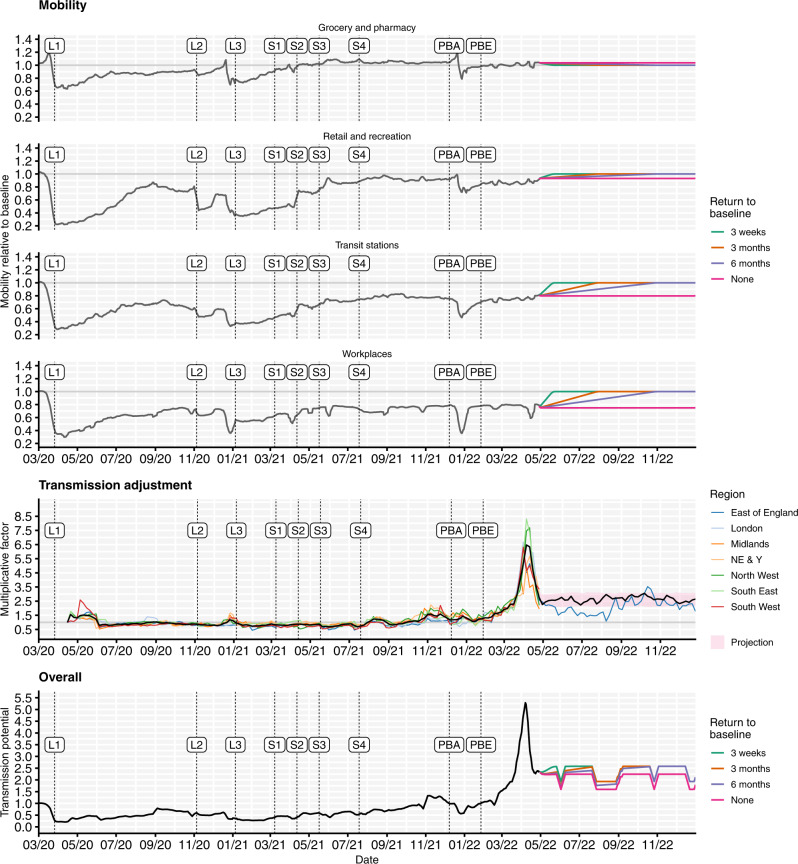
Fig. 3. Mobility scenarios, transmission adjustments and overall transmission potential for the fitted model, shown from March 2020 to December 2022.
Top: Historic Google Community Mobility data22 (grey) and assumed future mobility in England for no change (pink), a 3-week return to pre-pandemic baseline levels (green), a 3-month return to pre-pandemic baseline levels (orange) and a 6-month return to pre-pandemic baseline levels (purple) scenarios used for model projections. Mobility indices are measured relative to baseline mobility levels recorded during early 2020, prior to the COVID-19 pandemic. The beginning of each lockdown and each roadmap Step4 is marked with a vertical dashed line and ‘L’ and ‘S’ labels, respectively. Vertical dashed lines with ‘PBA’ and ‘PBE’ labels correspond to the announcement of ‘Plan B’ measures for England on 8th December 2021 and the ending of these measures on 27th January 202267. Middle: Fitted transmission adjustments between April 2020 and May 2022 by NHS England region (coloured lines) and the average across regions (black line), example projection between May and December 2022 for East of England (blue line) and mean (black line) and interquartile range (red shaded) for projected transmission adjustments between May and December 2022 across NHS England regions. Bottom: The overall transmission potential captures the combined impact of mobility and transmission adjustments on the time-varying potential for effective transmission, ignoring the impact of immunity and novel variants, though including the impact of school vacation periods. NE & Y North East & Yorkshire. NHS National Health Service.

