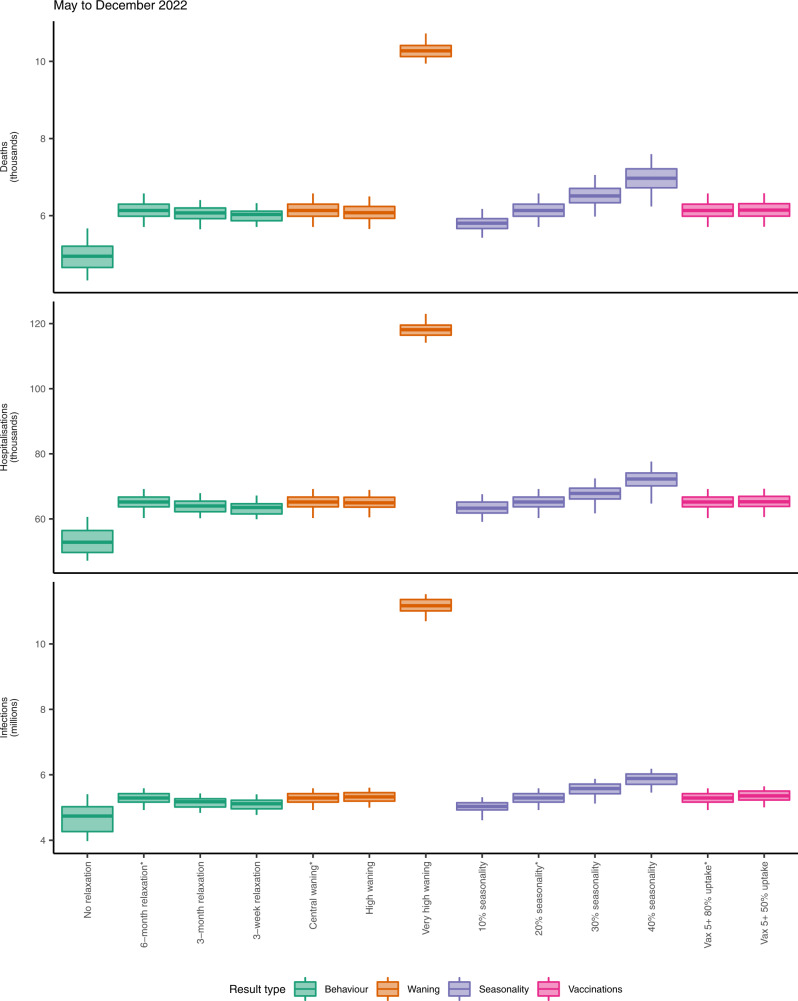
Fig. 5. Summary of projected cumulative numbers (log-scale) of COVID-19 deaths (thousands), hospital admissions (thousands) and infections (millions) in England between May and December 2022, across behavioural, waning, seasonality and vaccination scenarios considered.
Each box plot shows the projected median (central line), 5th (minima), 25th (lower bound of box), 75th (upper bound of box) and 95th (maxima) percentile values across 100 simulations for each relevant scenario, calculated between May and December 2022. Scenarios are coloured according to the result type (from left to right: behaviour, waning immunity, seasonality, and vaccination policies for children aged 5 years and older). A full list of scenarios and relevant modelling assumptions is given in Table 1. Scenarios marked with an asterisk (*) are equivalent and correspond to the basecase scenario. N.B. The y-axes are plotted on a log scale and are truncated and do not extend to zero.

