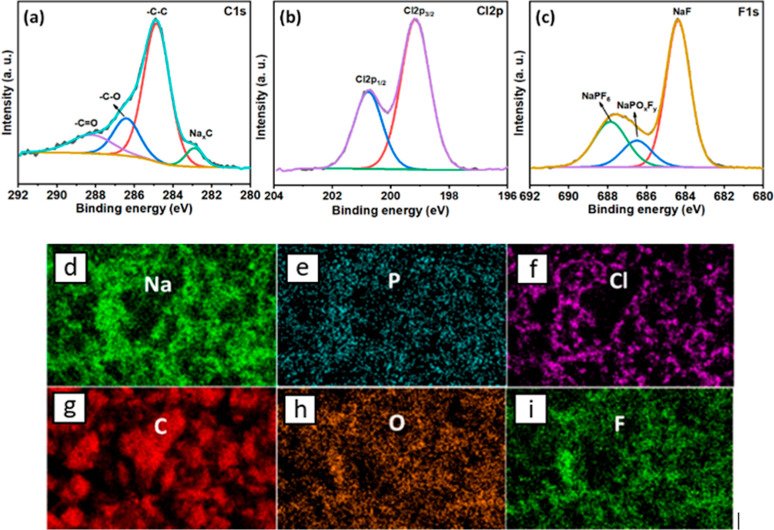
Figure 3.
XPS (a) C 1s, (b) Cl 2p, (c) F 1s spectra, and (d–i) SEM–EDX mapping of HC after 10 cycles in a half-cell containing 10 v/v % enflurane additive in 1 M NaPF6 in PC at 50 mA g–1. A SEM image and EDS spectrum of the area is shown in Figure S6.

