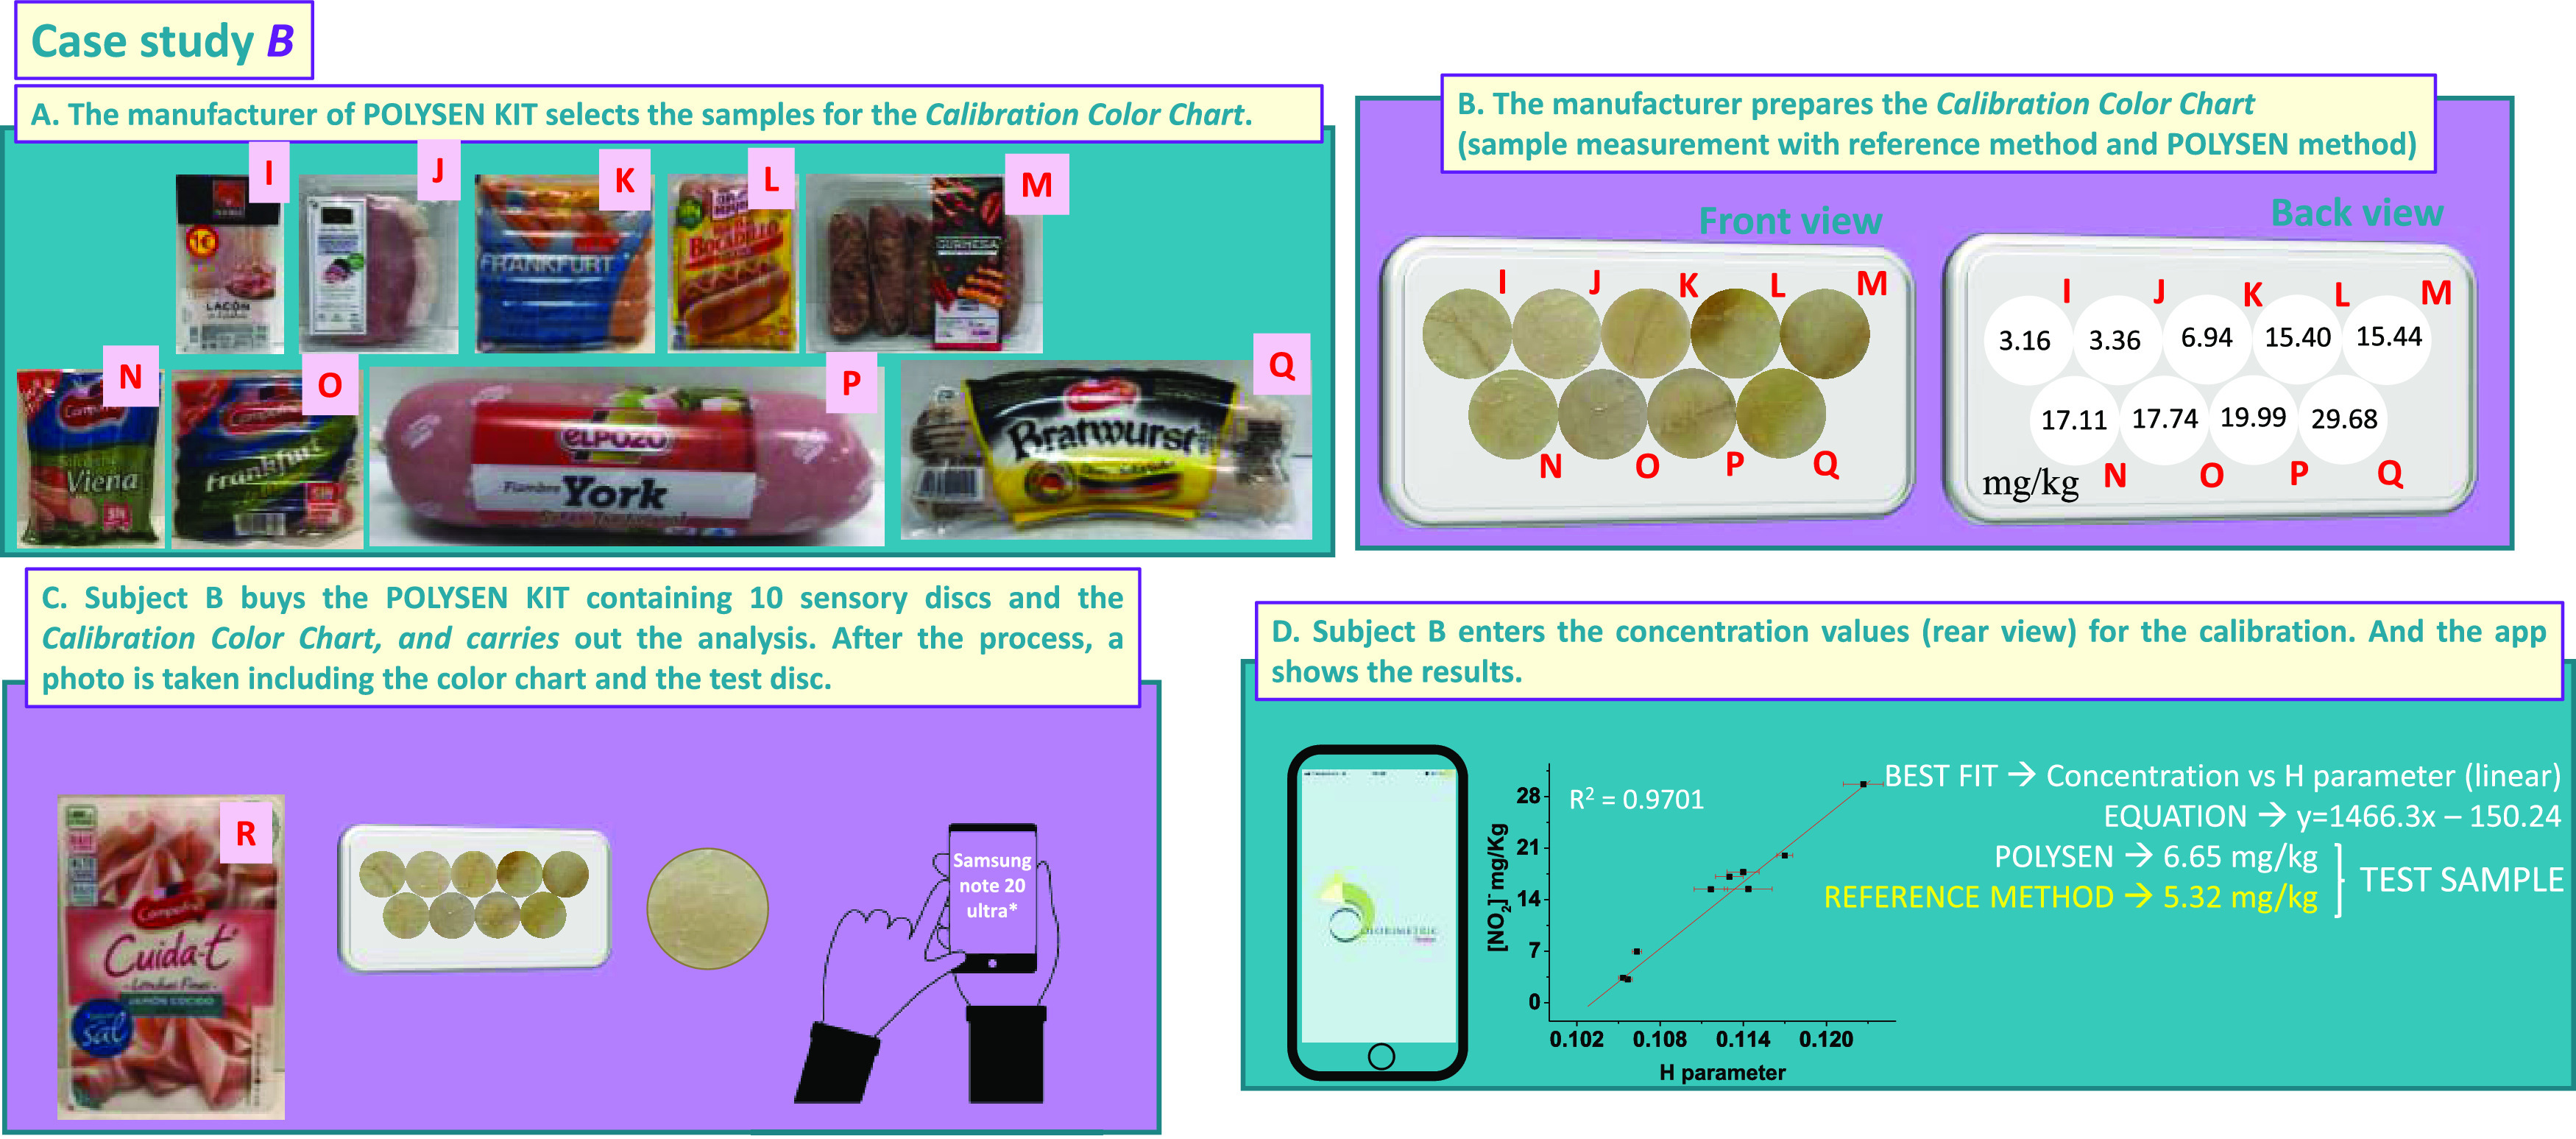
Figure 6.

Case study B of the proof of concept. (a) Choice of samples for the preparation of the calibration color chart; (b) calibration color chart, front and back view; (c) example of the measurement of a problem sample with a Samsung Note 20 Ultra 5G and a POLYSEN disk; and (d) results of the test sample obtained by the app Colorimetric Titration (the concentration value obtained by the reference method is also displayed).
