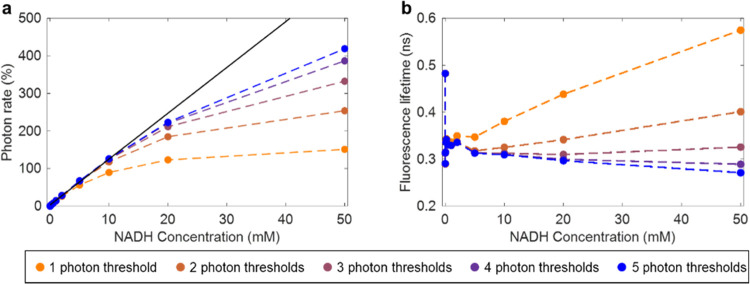
Figure 3.
Intensity linearity and fluorescence lifetime consistency acquired using HPD for different concentration of NADH with constant excitation power. (a) Intensity linearity given in calculated photon rate as a function of NADH concentration. The black line represents a linear fit for NADH concentrations 0–10 mM and associated photon rates. (b) Calculated fluorescence lifetime of NADH over the same range of concentrations.

