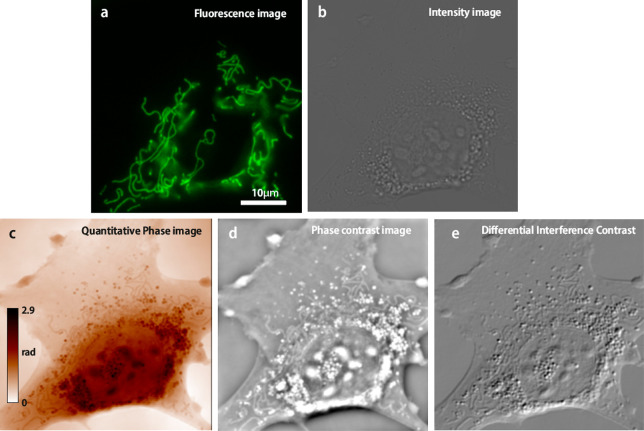
Figure 2.
Living cell (mouse embryonic fibroblast) observed with (a) fluorescence imaging (mitochondrial labeling), (b) transmission intensity, (c) quantitative phase, (d) phase contrast (simulated from (c)), and (e) differential interference contrast (simulated from (c)). The setup used is described in ref (37).

