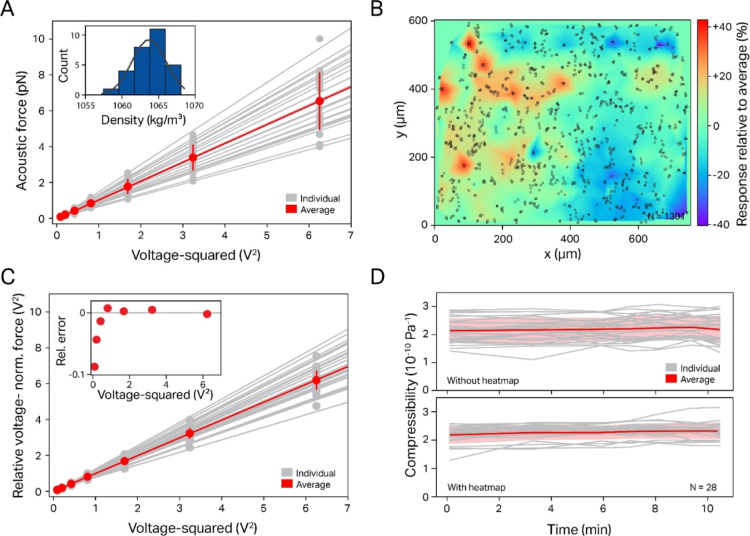
Figure 3.
Experimental data for different 5.31 μm PS particles from the same batch, including heat map calibration. (A) For all particles, the forces scale quadratically with the voltage; however, significant particle-to-particle variation is observed. (Inset) The calculated density distribution for the same batch of PS particles shows a very narrow distribution of <1% variance. (B) The calculated local VN force (here, accumulated over 469 beads) yields a “heat map” of this particular FOV (rel. field variance δfac = 0.35). Red/blue spots indicate strong/weak response of the local ASW field. (C) Reanalyzing the same data as that in (A) using the heat map calibration results in a significantly reduced particle-to-particle variation. (D) Showcase of heat map usage for continuous tracking of PS compressibility over time, where it decreases the error both for the total population (red) as well as that of individual particles (gray lines).

