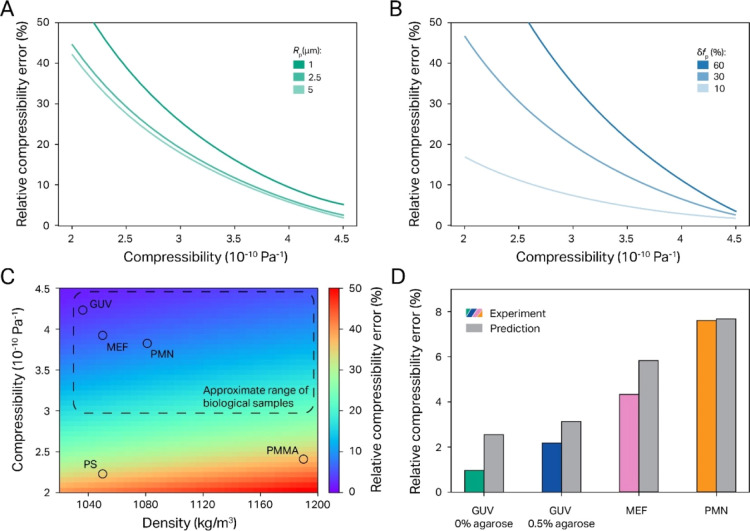
Figure 5.
Expected and measured experimental error of our QAP assay. (A) Plot of predicted rel. compressibility error δβp vs the absolute compressibility value βp for three different particle sizes shows a strong increase of δβp with βp (note, however, that relative errors remain <20% for compressibilities >3 × 10⁻¹⁰ Pa–1, which is the range expected for eukaryotic cells) (B) Plot of predicted δβp vs βp for three different variances in the ASW field. These curves demonstrate that the field heterogeneity has a much lower influence on the relative error when the particles compressibility is close to that of water. (C) δβp dependency on the density and compressibility of the sample for a range commonly found for biological samples (dotted line), as well as PS and PMMA particles (circles). (D) Comparison of the experimentally measured standard deviation with the predicted error for the biological sample data shown in Figure 4D demonstrates that the error estimates obtained above are not only realistic but even rather conservative.

