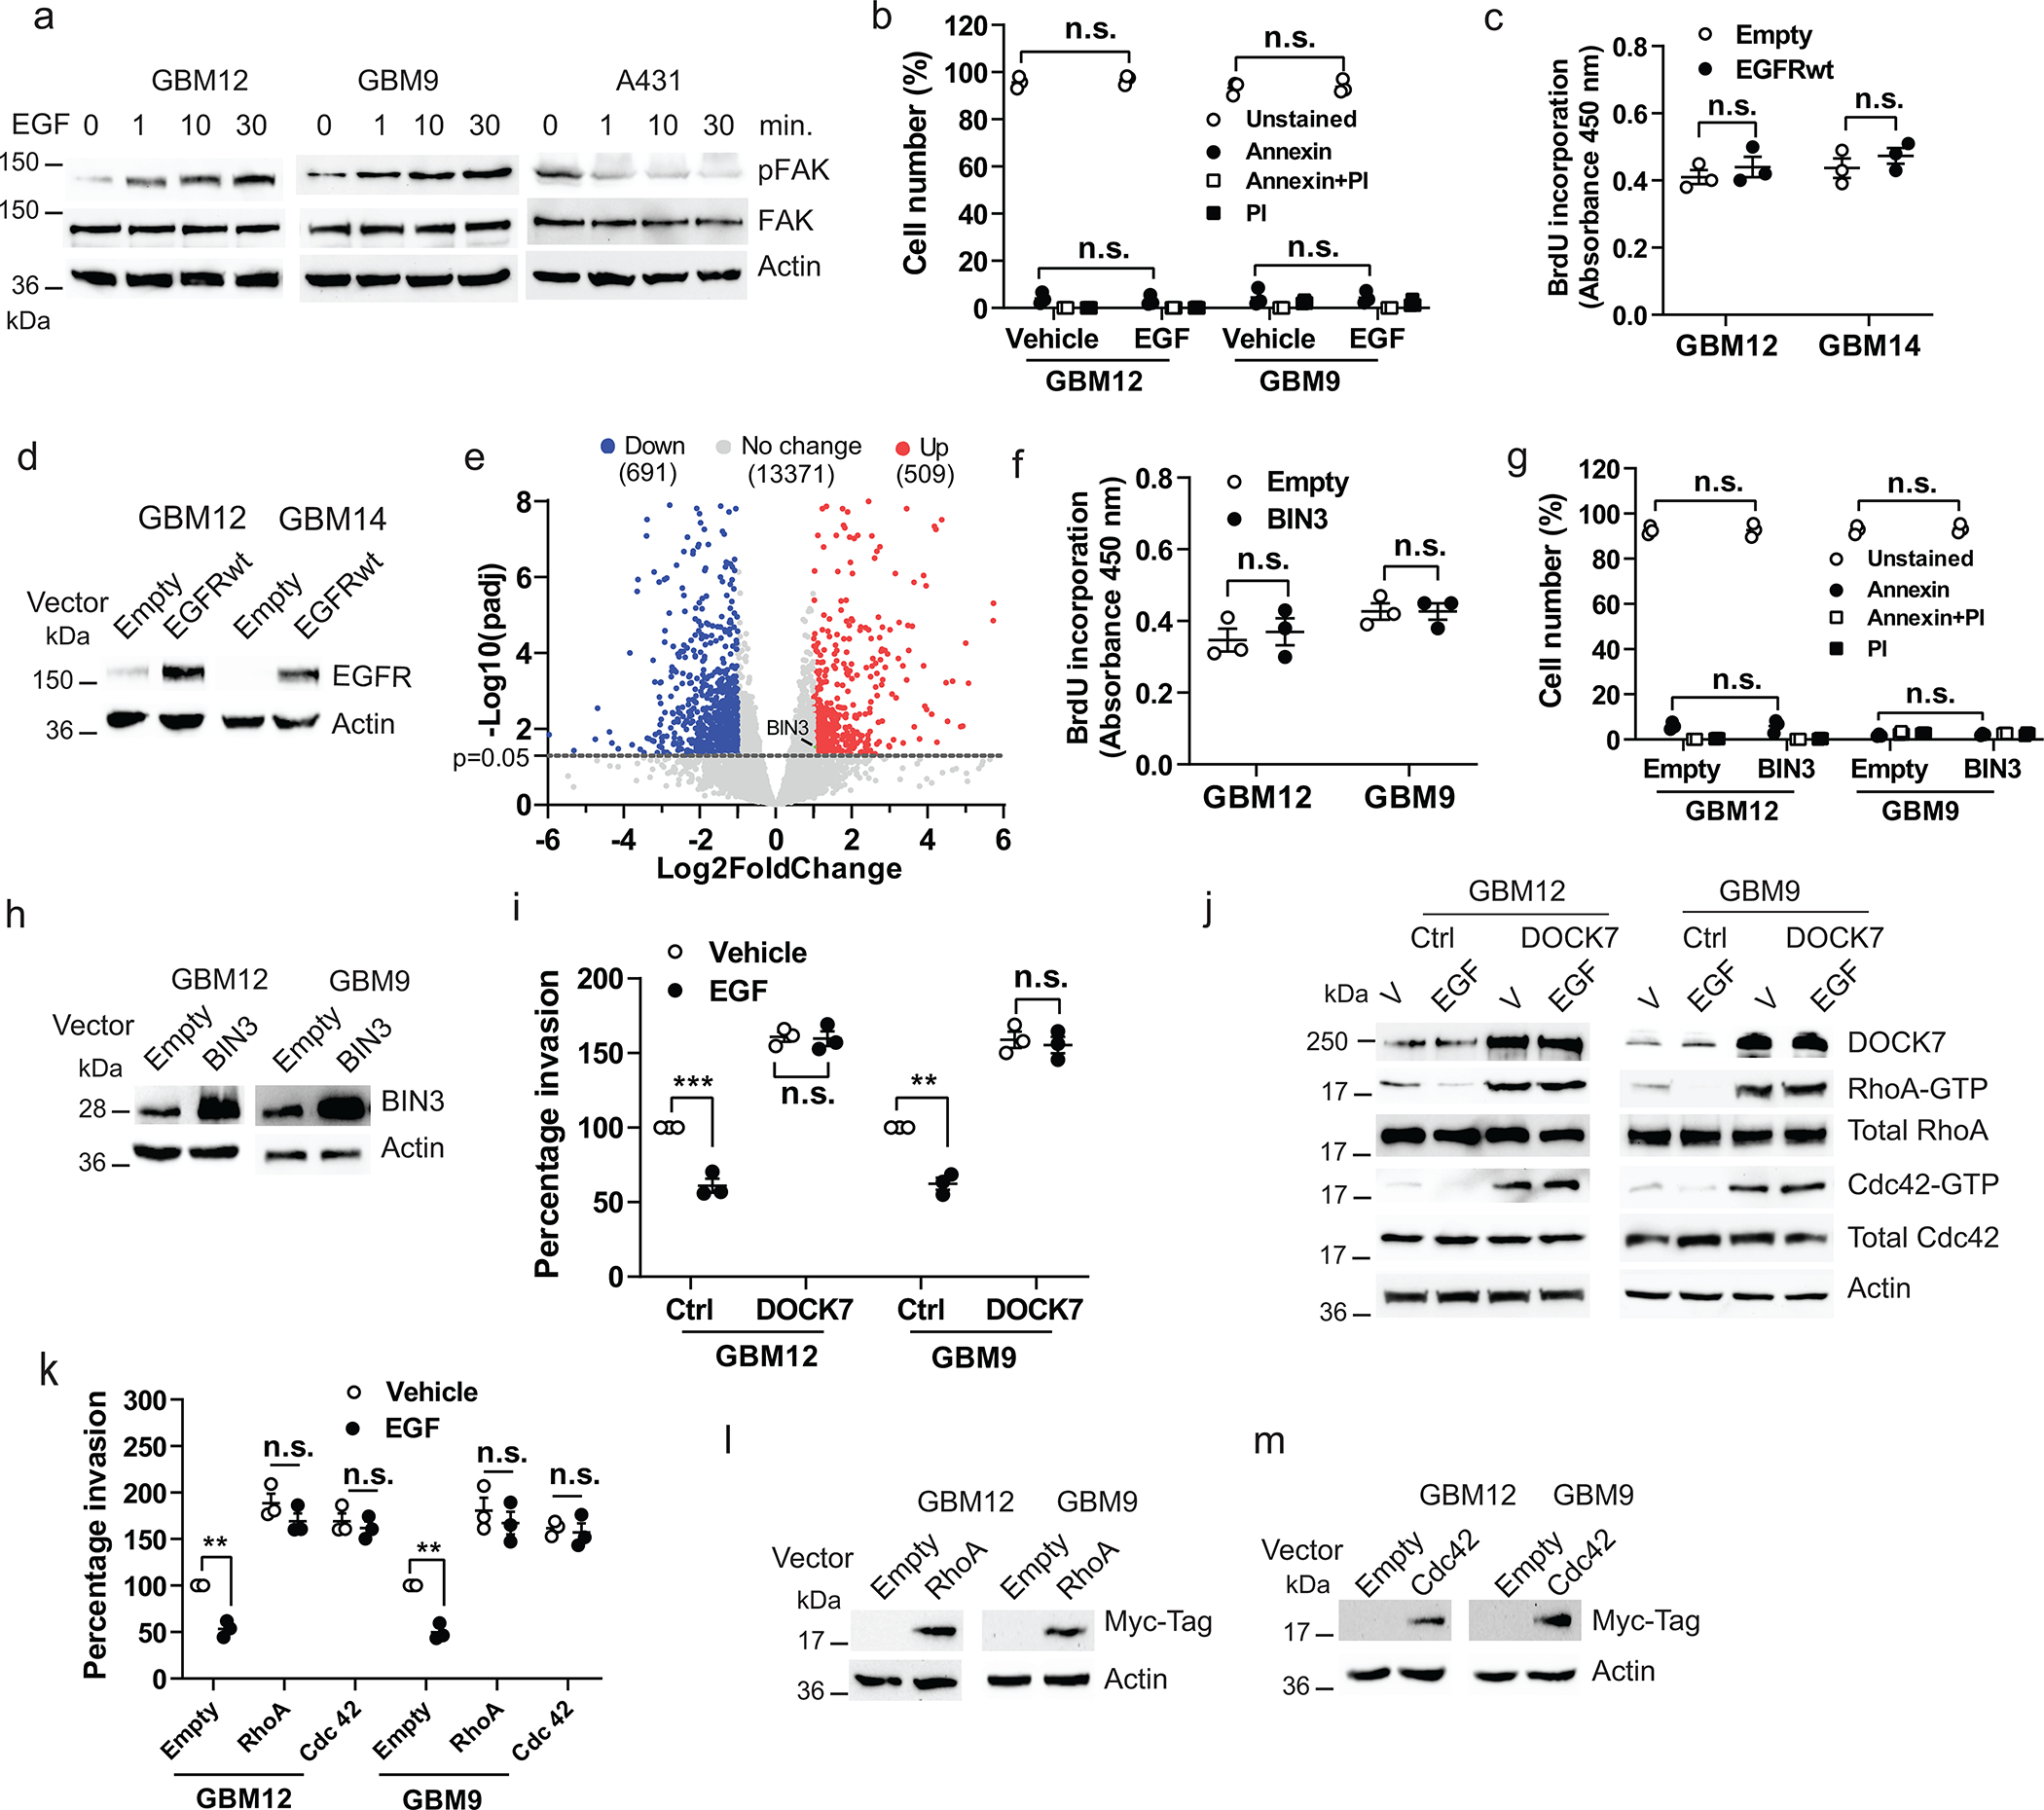
Extended Data Fig. 2. Suppression of invasion induced by EGF is mediated by an EGFR-BIN3-DOCK7 pathway.

a, Immunoblot of pFAK and FAK expression in cells treated with EGF (50 ng/ml) for the indicated times. b, Annexin V/PI positive staining assay of cells treated with EGF. c, BrdU incorporation assay of cells transiently transfected with empty or EGFRwt expression vectors. d, Overexpression of EGFRwt in cells was analyzed by Western blot. e, Volcano plot of differentially expressed genes as assessed by RNA-seq in vehicle or EGF treated GBM12. Significantly upregulated BIN3 is highlighted in green (Fold change=2.1, p=0.03). f, BrdU incorporation assay ofcells transiently transfected with empty or BIN3 vectors. g, Annexin V/PI positive staining assay of cells transiently transfected with empty or BIN3 expression vectors. h, BIN3 overexpression in cells was analyzed by Western blot. i, Matrigel invasion assay of DOCK7 overexpressing cells. Cells were infected with control or DOCK7 lentiviral activation particles, and 72 hours after infection invasion assay was performed in the presence or absence of EGF. j, Immunoblot of the indicated proteins in DOCK7 overexpressing cells treated with EGF for 24 hours. k, Matrigel invasion assay of cells transiently transfected with empty, Myc-RhoA or Myc-Cdc42 expression vectors in the presence or absenceof EGF. l-m, Overexpression of Myc-RhoA and Myc-Cdc42 was analzyed by Western blot. The Western blot images are representative of three independent biological replicates. Actin served as the loading control. The numbers below the blots indicate the relative band intensity of protein against that of actin. Data are represented as mean ± SEM from three independent experiments. Statistical significance was determined bytwo-way ANOVA adjusted by Bonferroni’s correction (b, g, i, k), or by two-tailed unpaired Student’s t-test (c, f). *P<0.05, **P< 0.01, ***P< 0.001, n.s. not significant. Numerical source data, statistic, exact P values and unprocessed blots are available as Source Data.
