
Extended Data Fig. 5. Biological effects of EGFR and STAT activation in GBM cells.
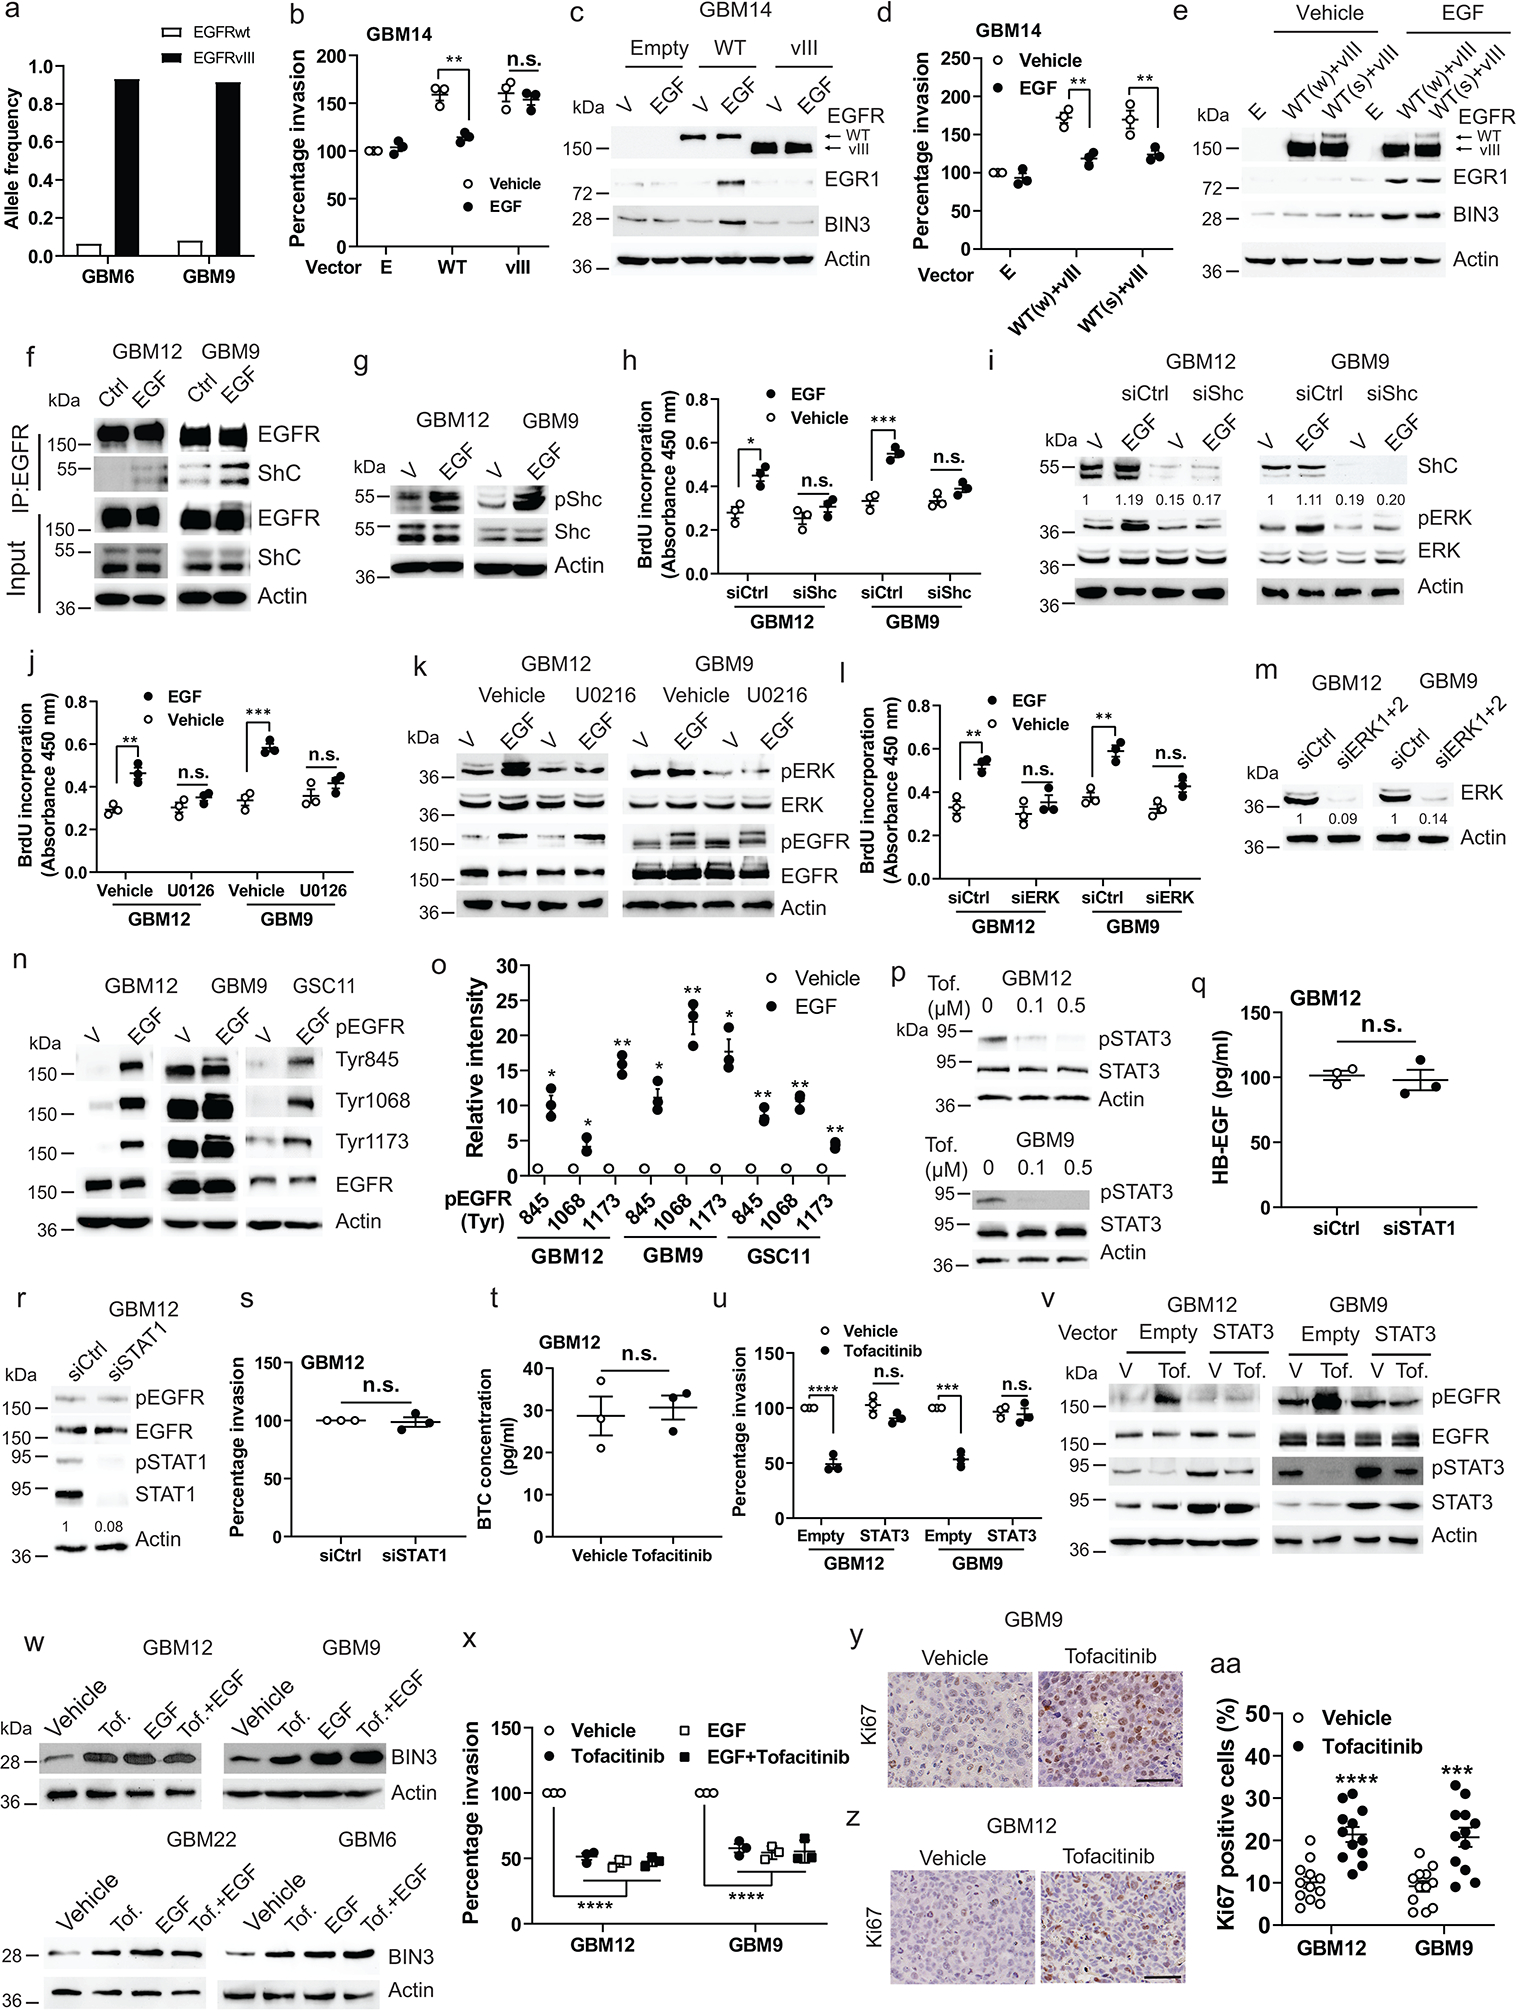
a, The allele frequency of EGFRwt and EGFRvIII in GBM6 and GBM9. b, Matrigel invasion assay of EGFRwt or EGFRvIII overexpressing GBM14 with or without EGF (50 ng/ml). c, Immunoblot of the indicated proteins in EGFRwt or vIII overexpressing GBM14 cells treated with EGF (24 h). d, Matrigel invasion assay of EGFRwt and vIII overexpressing GBM14 with or without of EGF.WT(w): weak expression of WT; WT(s): strong expression of WT. e, Immunoblot of the indicated proteins in EGFRwt and vIII overexpressing GBM14 treated with EGF (24h). f, Immunoblot of immunoprecipitated extracts from cells treated with EGF (30 min.). g, Immunoblot of the indicated proteins in cells treated with EGF (30 min.)h, BrdU incorporation assay of Shc siRNA knockdown cellstreated with EGF. i, Immunoblot of the indicated proteins in Shc siRNA knockdown cells treated with EGF (30 min.). j, BrdU incorporation assay of cells treated with EGF, U0126 or a combination. k, Immunoblot of the indicated proteins in cells treated with EGF or U0126 or a combination (30 min.). l, BrdU incorporation assay of ERK siRNA knockdown cells treated with EGF. m, Knockdown efficiency of ERK was analyzed by Western blot. n, Immunoblot of different Tyr resides of pEGFR in multiple lines treated with EGF (30 min.). o, Quantification of Western blot band intensity with actin as reference. p, Immunoblot of the indicated proteins in cells treated with tofacitinib (Tof.). q, ELISA for HB-EGF in the supernatant of STAT1 siRNA knockdown GBM12. r, Immunoblot of pEGFR and pSTAT1 in STAT1 siRNA knockdown GBM12. s, Matrigel invasion assay of control or STAT1 siRNA knockdown GBM12. t, ELISA for BTC in the supernatants of GBM12 treated with tofacitinib (72 h). u, Matrigel invasion assay of STAT3 overexpressing GBM12 in response to tofacitinib. v, Immunoblot of the indicated proteins in STAT3 overexpressingcells treated with tofacitinib. w, Immunoblot of BIN3 in multiple lines treated with EGF, tofacitinib or both (48 h). x, Matrigel invasion assay with EGF or tofacitinib or both. y-aa, Ki67 immunostaining and quantification of KI67 positive cells in GBM12 and GBM9 tumours from tofacitinib treated mice. Scale bars: 50 μM. The Western blot images are representative of three independent biological replicates. Actin served as the loading control. The numbers below the blots indicate the relative band intensity of protein against that of actin. Data are represented as mean ± SEM from three independent experiments. Statistical significance was determined by two-way ANOVA adjusted by Bonferroni’s correction (b, d, h, j, l, u), or by two-tailed one-sample Student’s t-test (o, s), or by two-tailed unpaired Student’s t-test (q, aa), or by one-way ANOVA adjusted by Bonferroni’s correction (x). *P<0.05, **P< 0.01, ***P< 0.001, ****P< 0.001, n.s. not significant. Numerical source data, statistic, exact P values and unprocessed blots are available as Source Data.