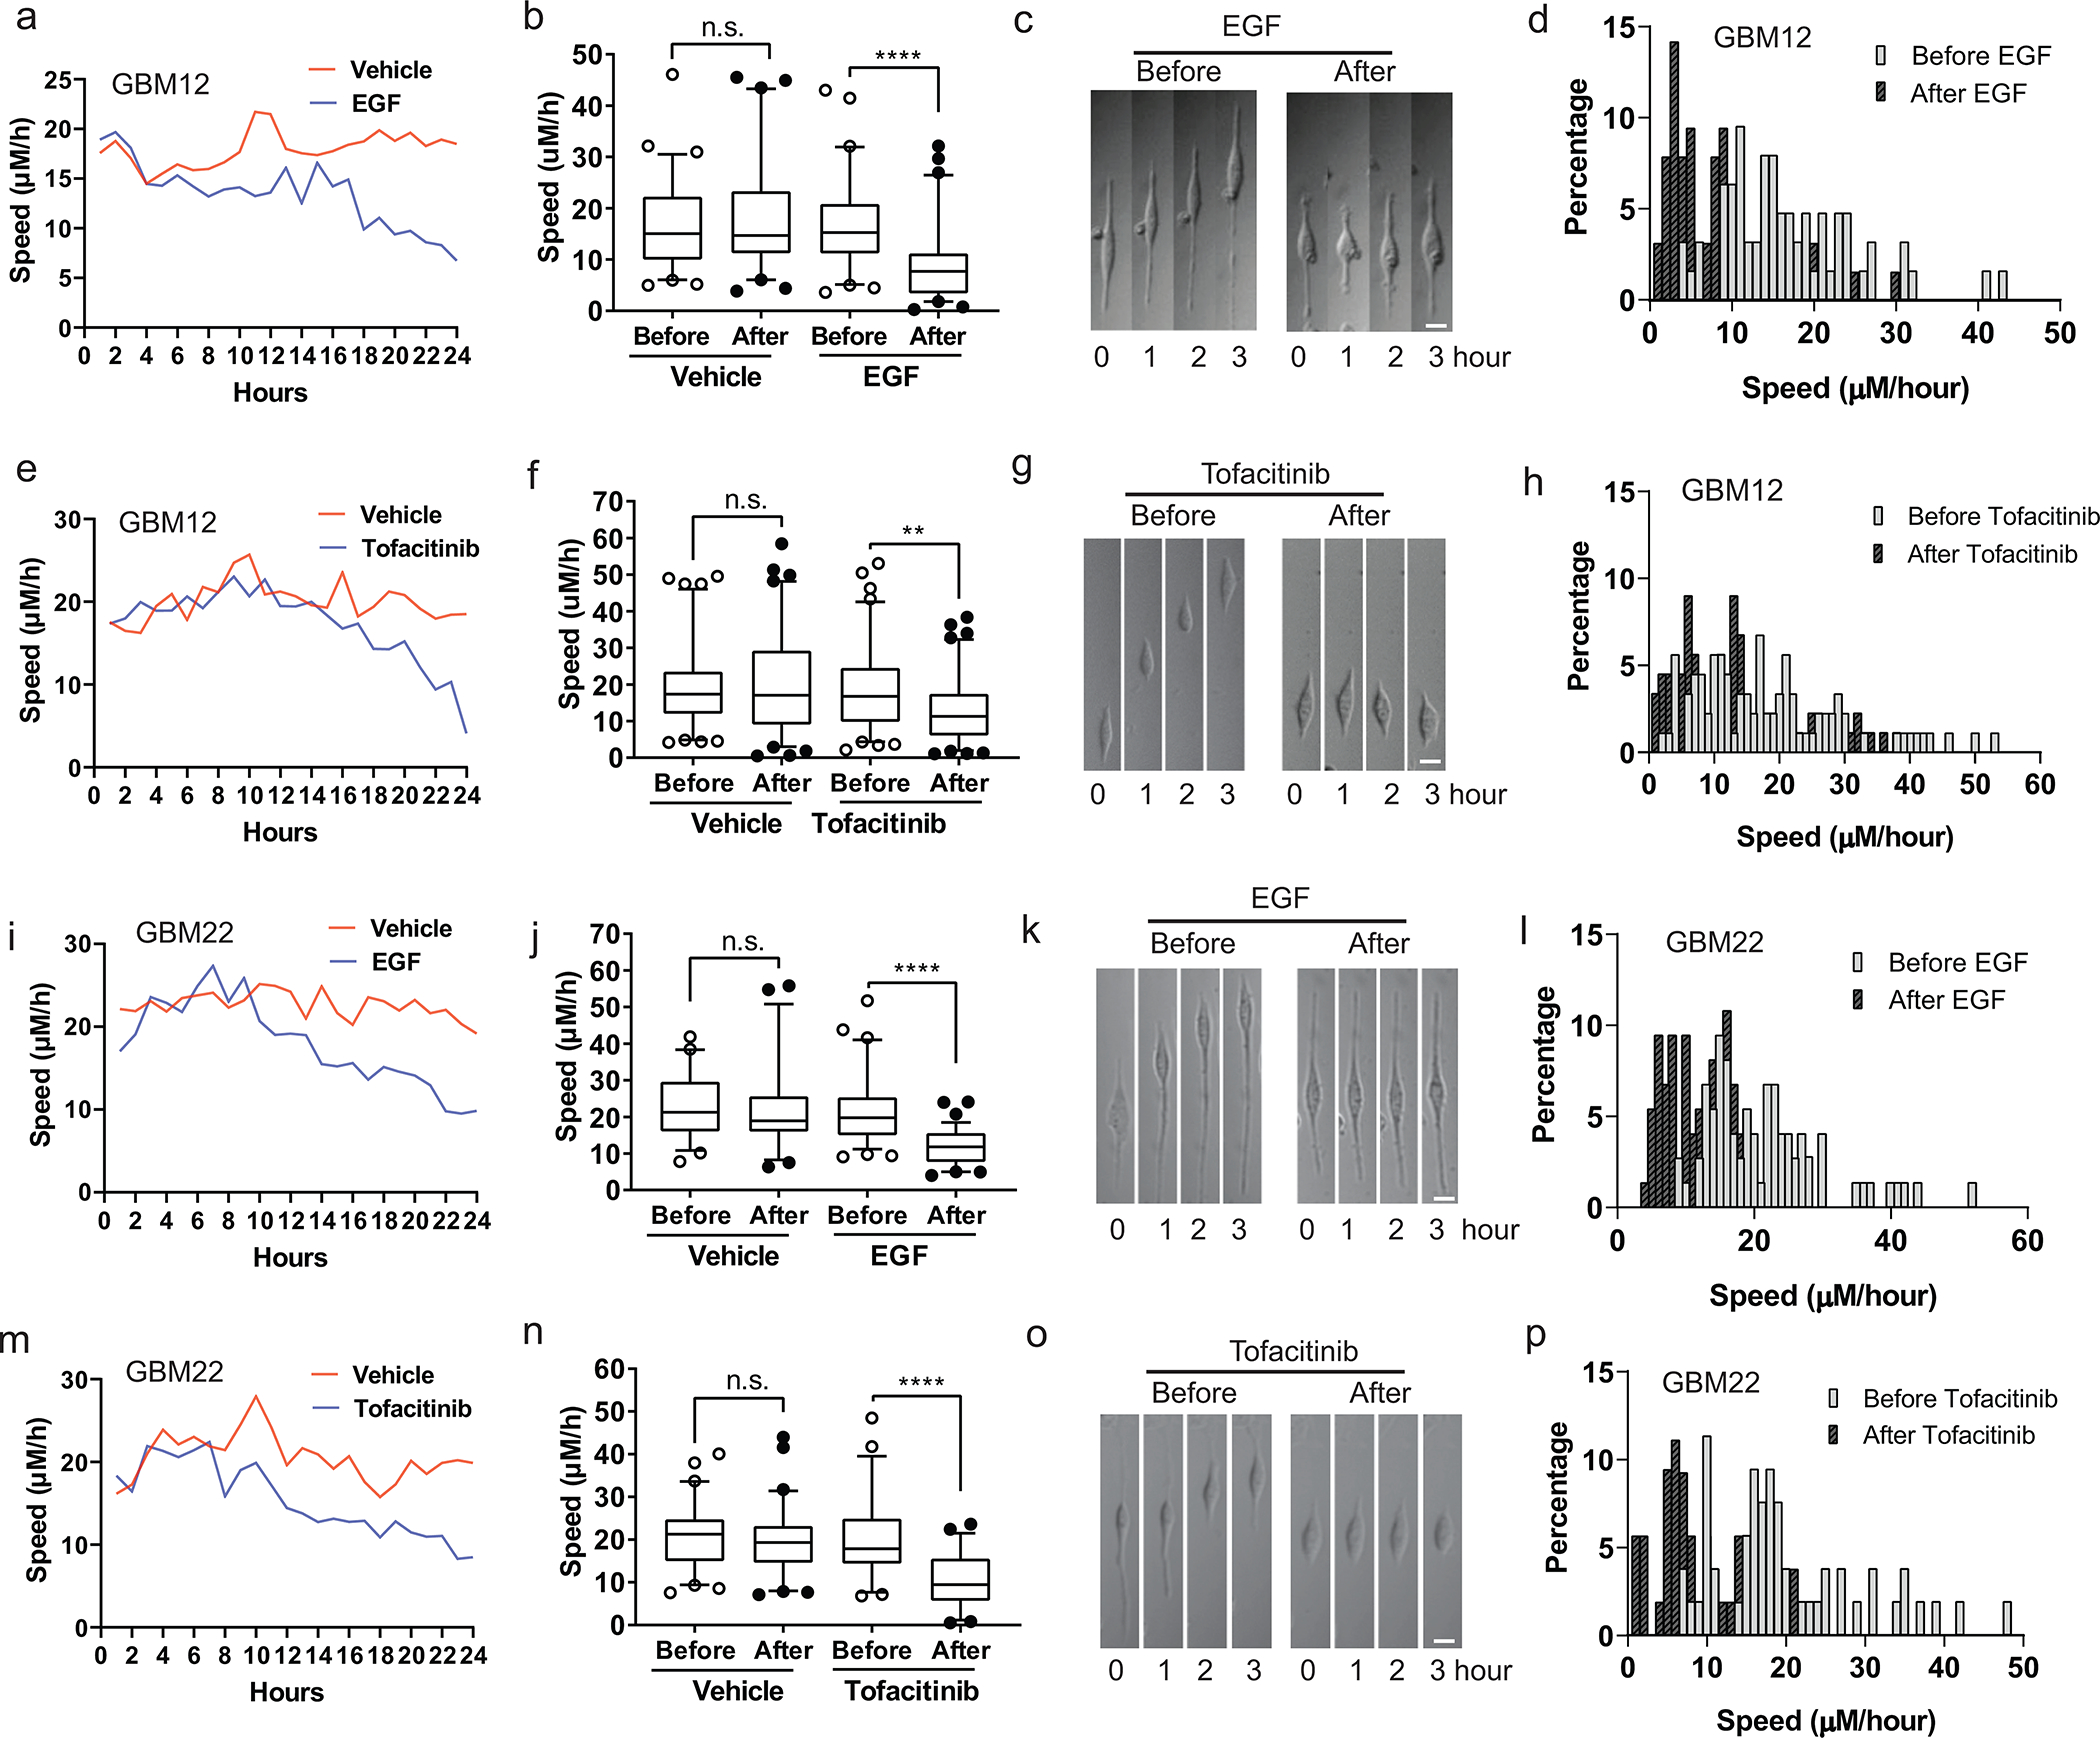
Extended Data Fig. 6. EGF and tofacitinib suppress migration in single cell analysis.

a, Time-lapse migration speed in GBM12 before and after addition of vehicle (n=67) or EGF (50 ng/ml)(n=63). b, Quantification of migration velocity of GBM12 before and after addition of vehicle or EGF. Cell migration velocity was calculated over a period of 6 hours. c, Representative static time-lapse images of the same cell migration before and after addition of EGF. d, Percentage of cell migration speed before and after addition of EGF. e, Time-lapse migration speed in GBM12 before and after addition of vehicle (n=81) or tofacitinib (1 μM) (n=89). f, Quantification of migration velocity of GBM12 before and after addition of vehicle or tofacitinib. g, Representative static time-lapse images of the same cell migration before and after addition of tofacitinib. h, Percentage of cell migration speed before and after addition of tofacitinib. i, Time-lapse migration speed in GBM22 before and after addition of vehicle (n=57) or EGF (n=74). j, Quantification of migration velocity of GBM22 before and after addition of vehicle or EGF. k, Representative static time-lapse images of the same cell migration before and after addition of EGF. l, Percentage of cell migration speed before and after addition of EGF. m, Time-lapse migration speed in GBM22 before and after addition of vehicle (n=61) or tofacitinib (n=53). n, Quantification of migration velocity of GBM22 before and after addition of vehicle or tofacitinib. o, Representative static time-lapse images of the same cell migration before and after addition of tofacitinib. p, Percentage of cell migration speed before and after addition of tofacitinib. Scale bars: 10 μM (c, g, k and o). Whiskers of the boxplot mark the 5th and 95th percentiles, the box marks the 25th to the 75th percentiles with the median (b, f, j, m). **P < 0.001, **** P < 0.0001, n.s. not significant, P values were determined using two-tailed Wilcoxon matched pair tests(b, f, j, n). The results are representative of two independently repeated experiments. Numerical source data, statistic and exact P values are available as Source Data.
