
Extended Data Fig. 7. EGFR ligands, EGFR, BIN3 and Sp1 expression in human glioblastoma.
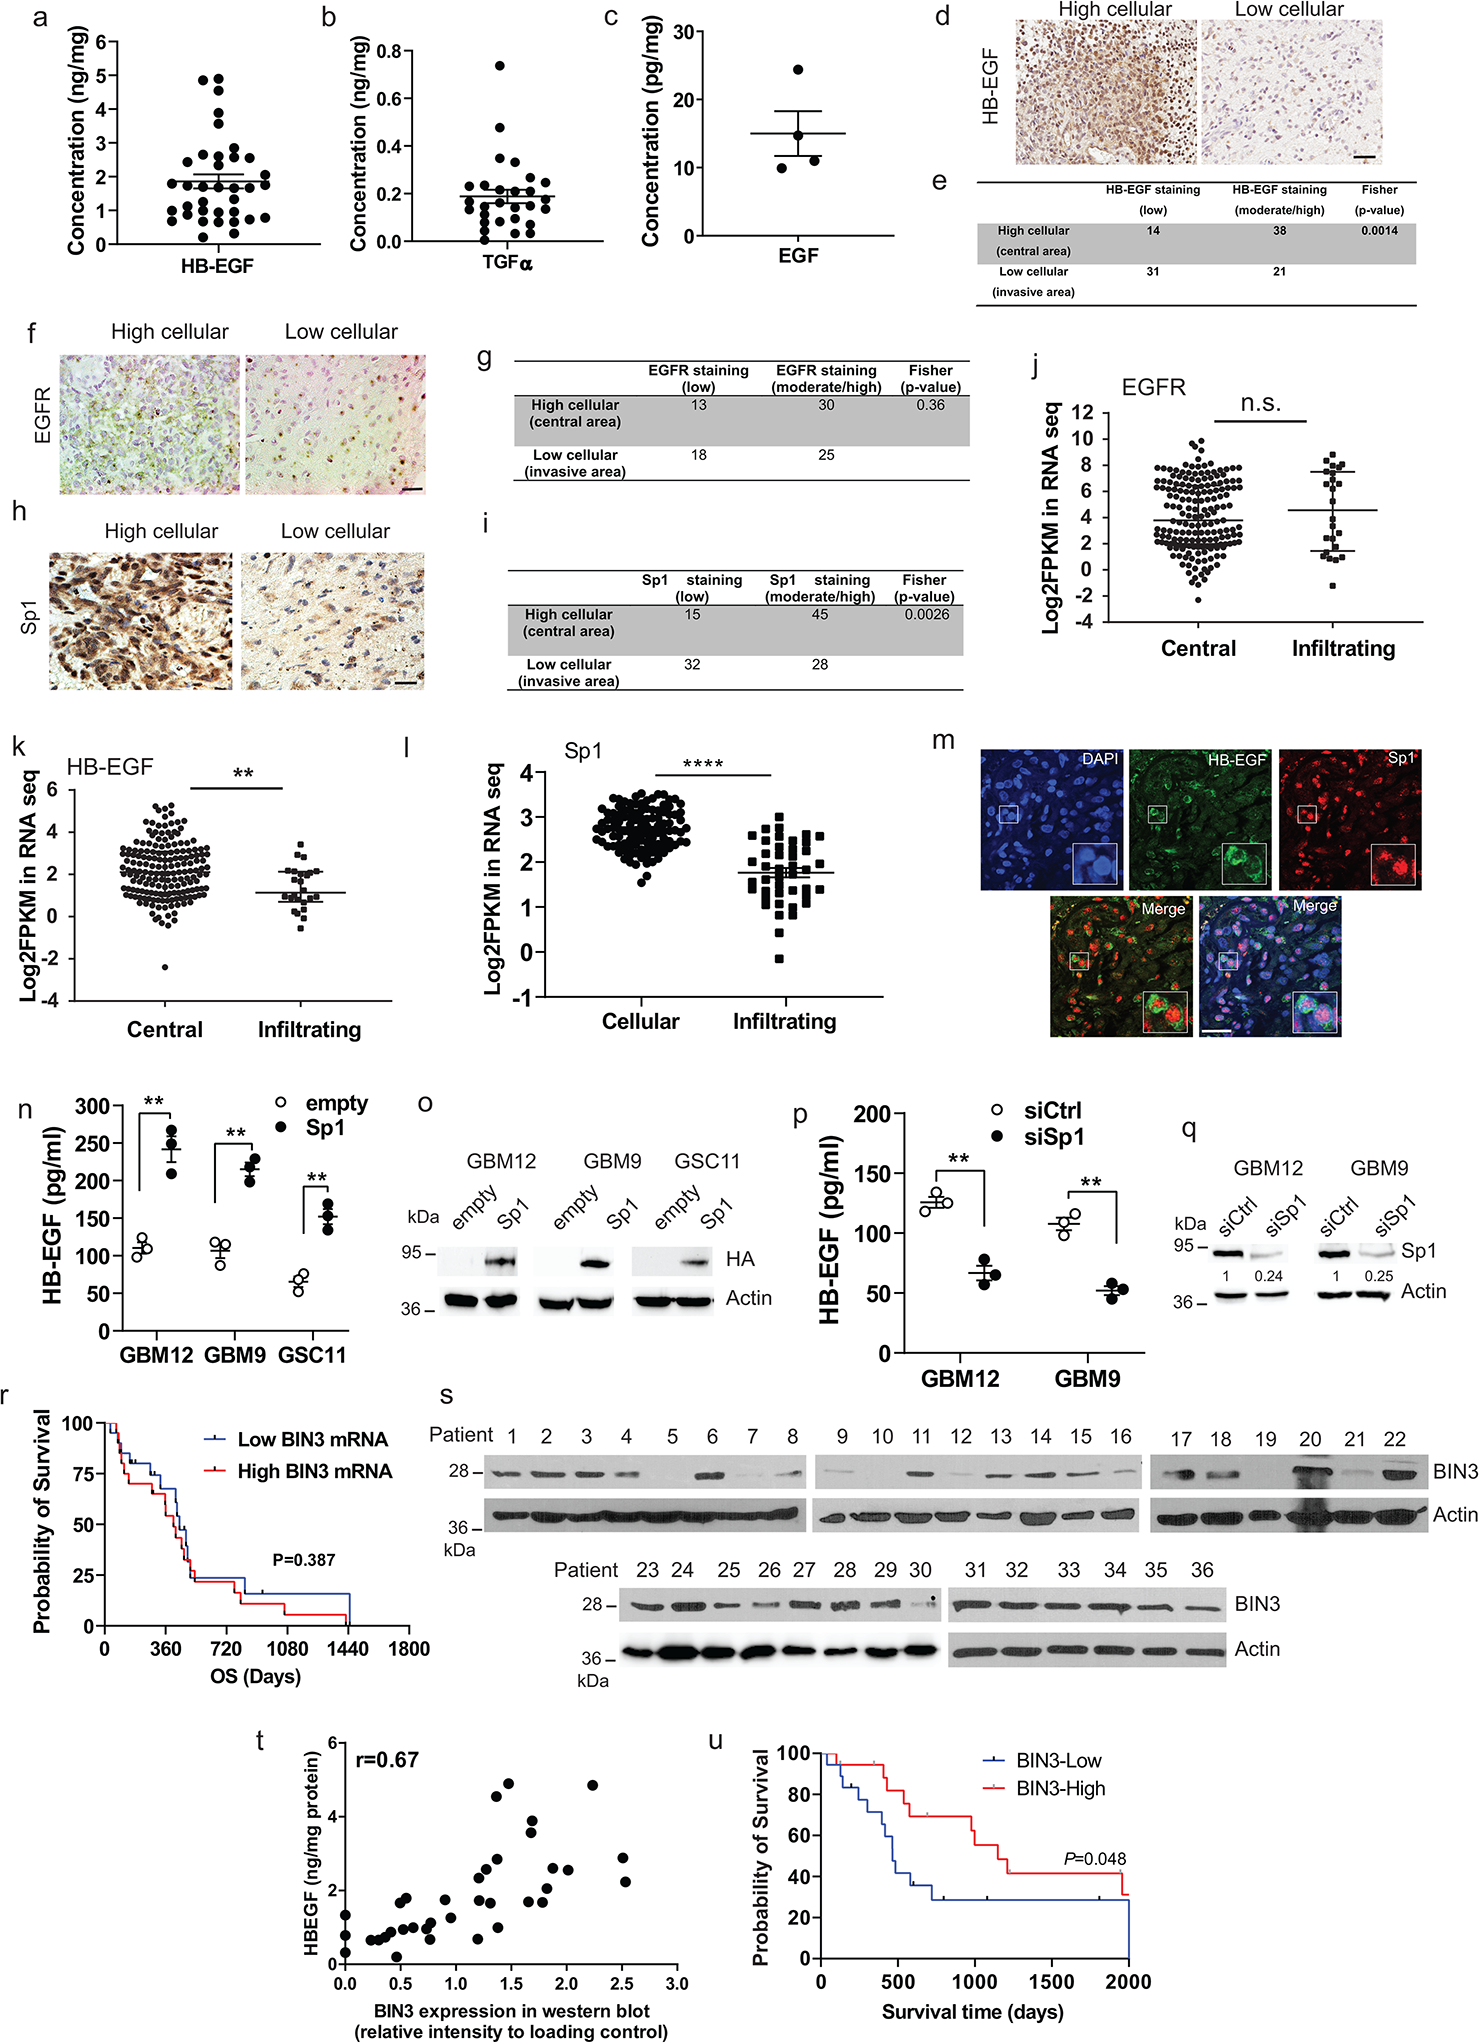
a-c, ELISA for HB-EGF, TGFα and EGF in human glioblastoma lysates. d, Representative immunohistochemical staining of HB-EGF in human glioblastoma. e, Summary of HB-EGF staining in high and low cellular areas across the tissue sections from 20 samples. Score 0 and 1 are defined as low, 2 and 3 are defined as moderate/high. Staining intensity in the two areas were compared using Fisher’s exact test. f, Representative EGFR immunostaining in high cellular (central) and low cellular (infiltrating) areas of human glioblastoma. g, Summary of EGFR staining of the tissue sections from 20 samples. h, Representative Sp1 immunostaining in high cellular and low cellular areas of human glioblastoma. i, Summary of Sp1 staining of the tissue sections from 20 samples. j-l, Ivy Atlas distribution of EGFR, HB-EGF and Sp1 mRNA expression in central and infiltrating areas of human GBM. m, Representative images of fluorescent double staining of HB-EGF (green) and Sp1 (red) in human GBM tissue sections. n, ELISA for HB-EGF in multiple lines transiently transfected with empty or HA-Sp1 vectors. o, HA-Sp1 overexpression was analyzed by Western blot. p, ELISA for HB-EGF in Sp1 siRNA knockdown cells. q, Sp1 siRNA knockdown was analyzed by Western blotting. r, Overall survival (OS) analysis according to BIN3 mRNA levels in classical GBM patients with amplified EGFR. s, Immunoblot of BIN3 expression in human glioblastoma extracts. t, Scatter plot of HB-EGF and BIN3 expression in human glioblastoma lysates (n=36). u, Kaplan-Meier curves of survival rates for high and low levels of BIN3 assessed by Western blot. The Western blot images are representative of three independent biological replicates. Actin served as the loading control. The numbers below the blots indicate the relative band intensity of protein against that of actin. Scale bars: 50 μM. Data are represented as mean ± SEM from three independent experiments. Significance was determined by Kolmogorov Smimov test (j, k, l), or by two-tailed unpaired Student’s t-test (n, p), or by log-rank test (r, u). **P< 0.01, ****P< 0.001, n.s. not significant. Numerical source data, statistic, exact P values and unprocessed blots are available as Source Data.