
Figure 3. BIN3 inhibits invasiveness of glioma cells through its interaction with DOCK7.
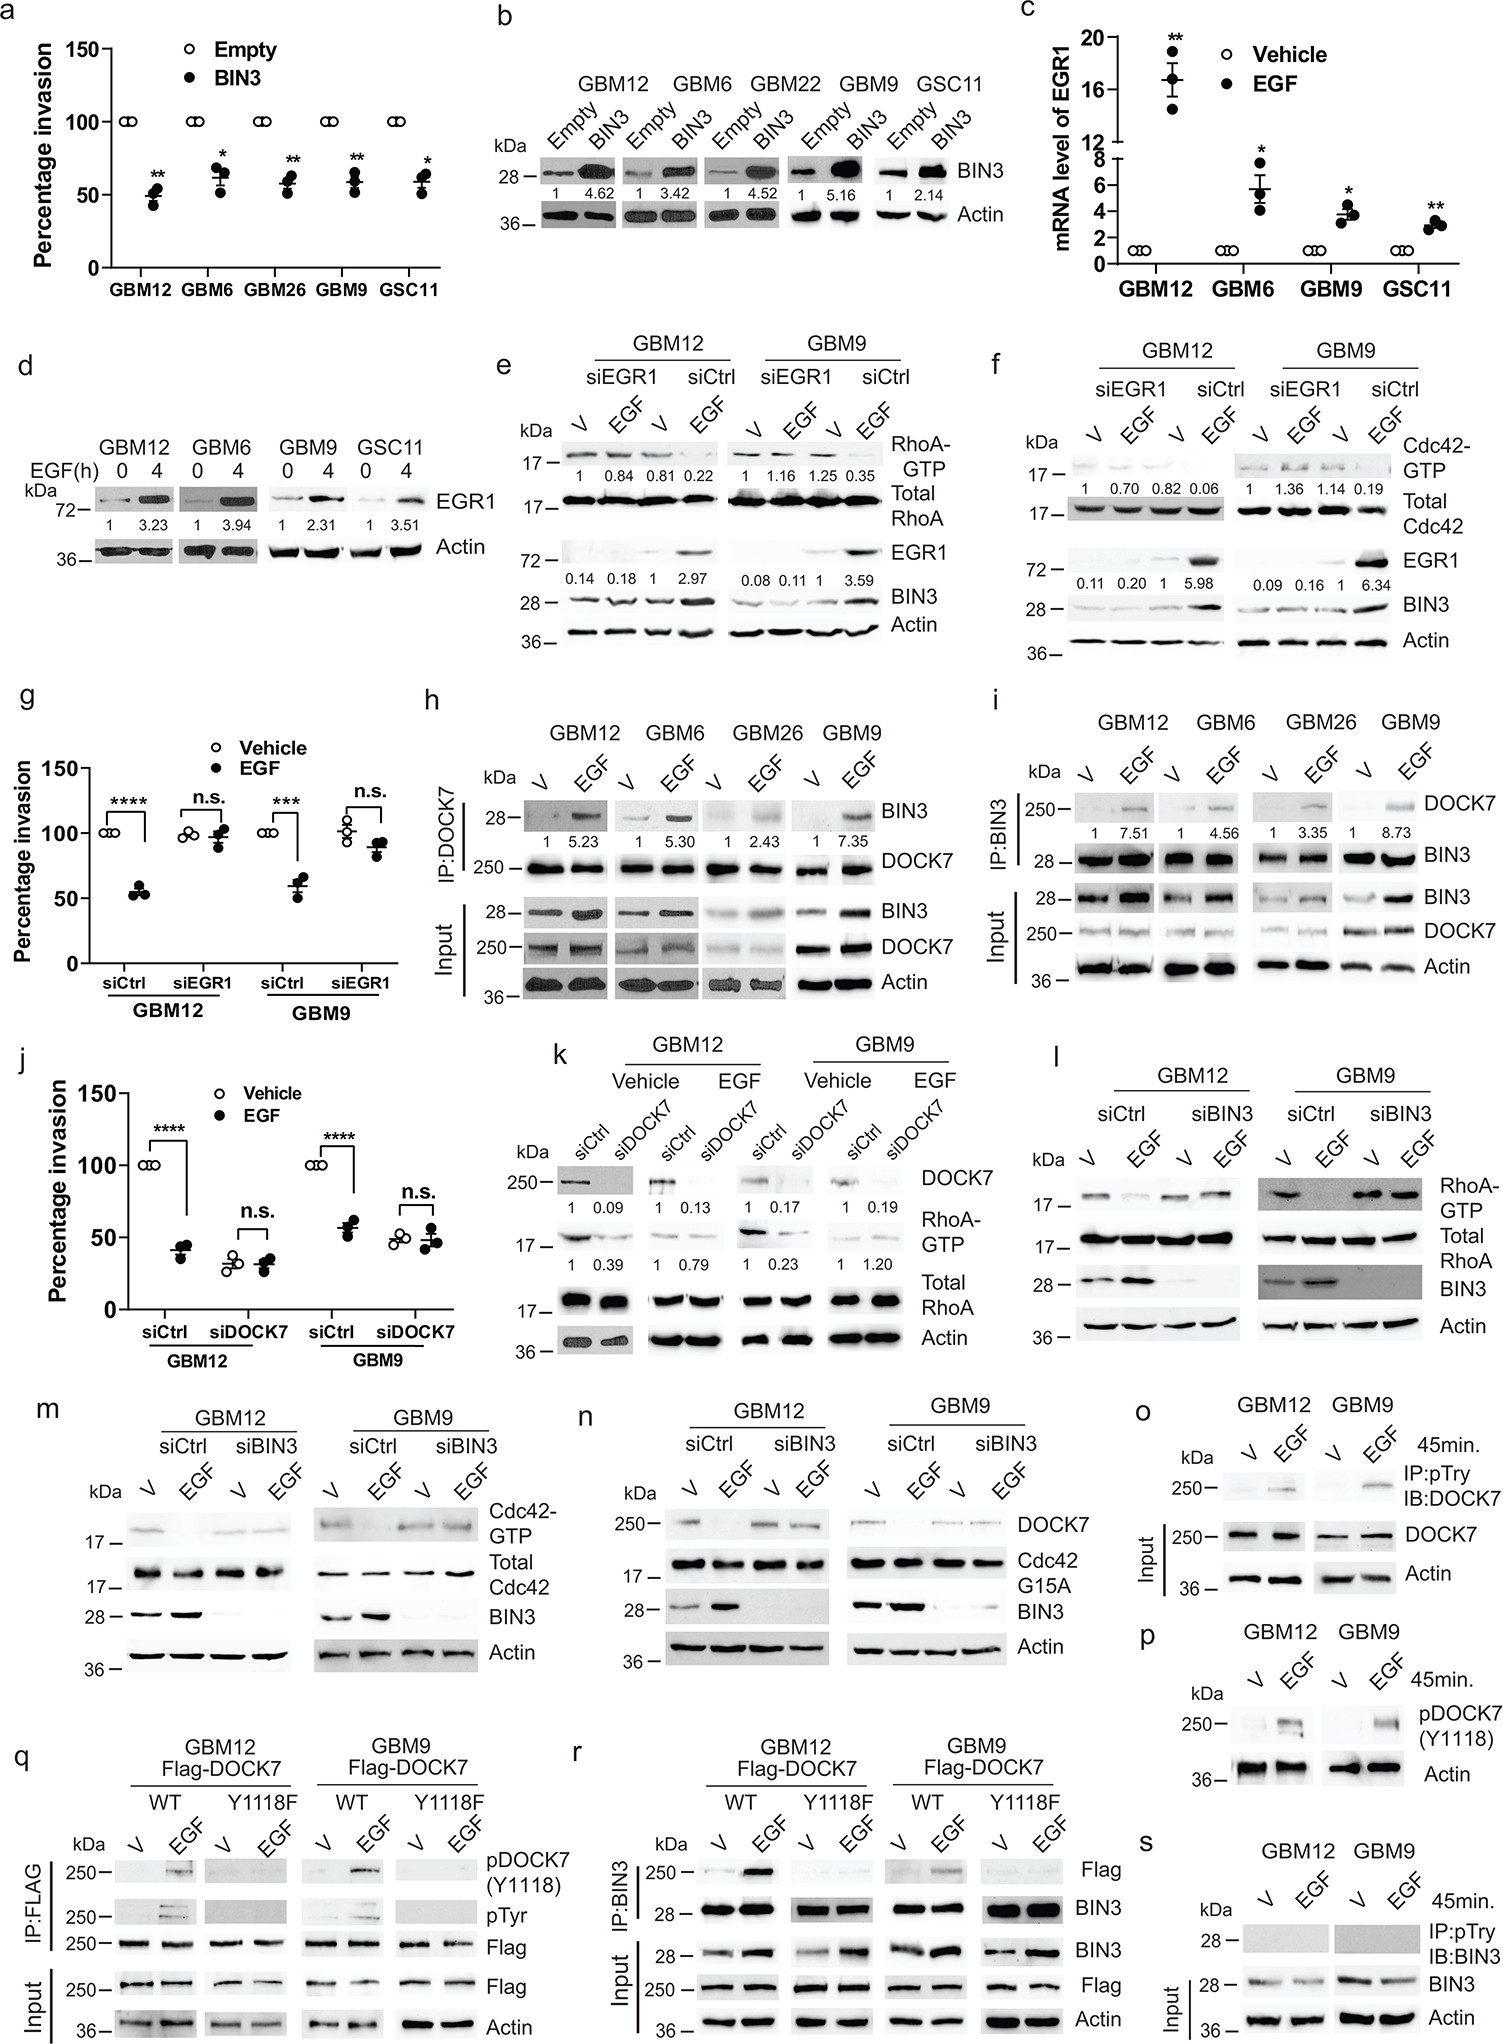
a, Matrigel invasion assay of multiple lines with BIN3 overexpression. b, BIN3 overexpression was analyzed by Western blot. c, EGR1 mRNA levels in multiple lines treated with EGF (50 ng/ml) for 2 hours. d, Immunoblot of EGR1 in cells treated with EGF. e-f, Immunoblot of the indicated proteins in EGR1 siRNA knockdown cells treated with EGF. g, Matrigel invasion assay of EGR1 siRNA knockdown cells in the presence or absence of EGF. h-i, Immunoblot of immunoprecipitated (IP) extracts from multiple lines treated with EGF for 24 hours. j, Matrigel invasion assay of DOCK7 siRNA knockdown GBM12 and GBM9 in the presence or absence EGF (50 ng/ml). k, Immunoblot of the indicated proteins in DOCK7 siRNA knockdown in cells treated with EGF for 24 hours. l-m, Immunoblot of the indicated proteins in BIN3 siRNA knockdown cells treated with EGF (50 ng/ml) for 24 hours. n, Immunoblot of active DOCK7 in EGF treated control or BIN3 siRNA knockdown cells. o, Immunoblot of IP extracts from cells treated with vehicle or EGF. p, Immunoblot of phosphorylated DOCK7(Y1118) in cells treated with vehicle or EGF. q-r, Immunoblot of IP extracts from wild-type or mutant (Y1118F) Flag-DOCK7 overexpressing cells treated with vehicle or EGF. s, Immunoblot of IP extracts from cells treated with vehicle or EGF. The Western blot images are representative of three independent biological replicates. Actin served as the loading control. The numbers below the blots indicate the relative band intensity of protein against that of actin. Data are represented as mean ± SEM from three independent experiments. Statistical significance was determined by two-tailed one-sample Student’s t-test (a, c), or by two-way ANOVA adjusted by Bonferroni’s correction (g, j). *P <0.05, **P < 0.01, ***P < 0.001, ****P < 0.001, n.s. not significant. Numerical source data, statistic, exact P values and unprocessed blots are available as Source Data.