
Figure 4. TGFα overexpression prolongs survival, reduces invasiveness and increases proliferation in orthotopic glioblastoma mouse model.
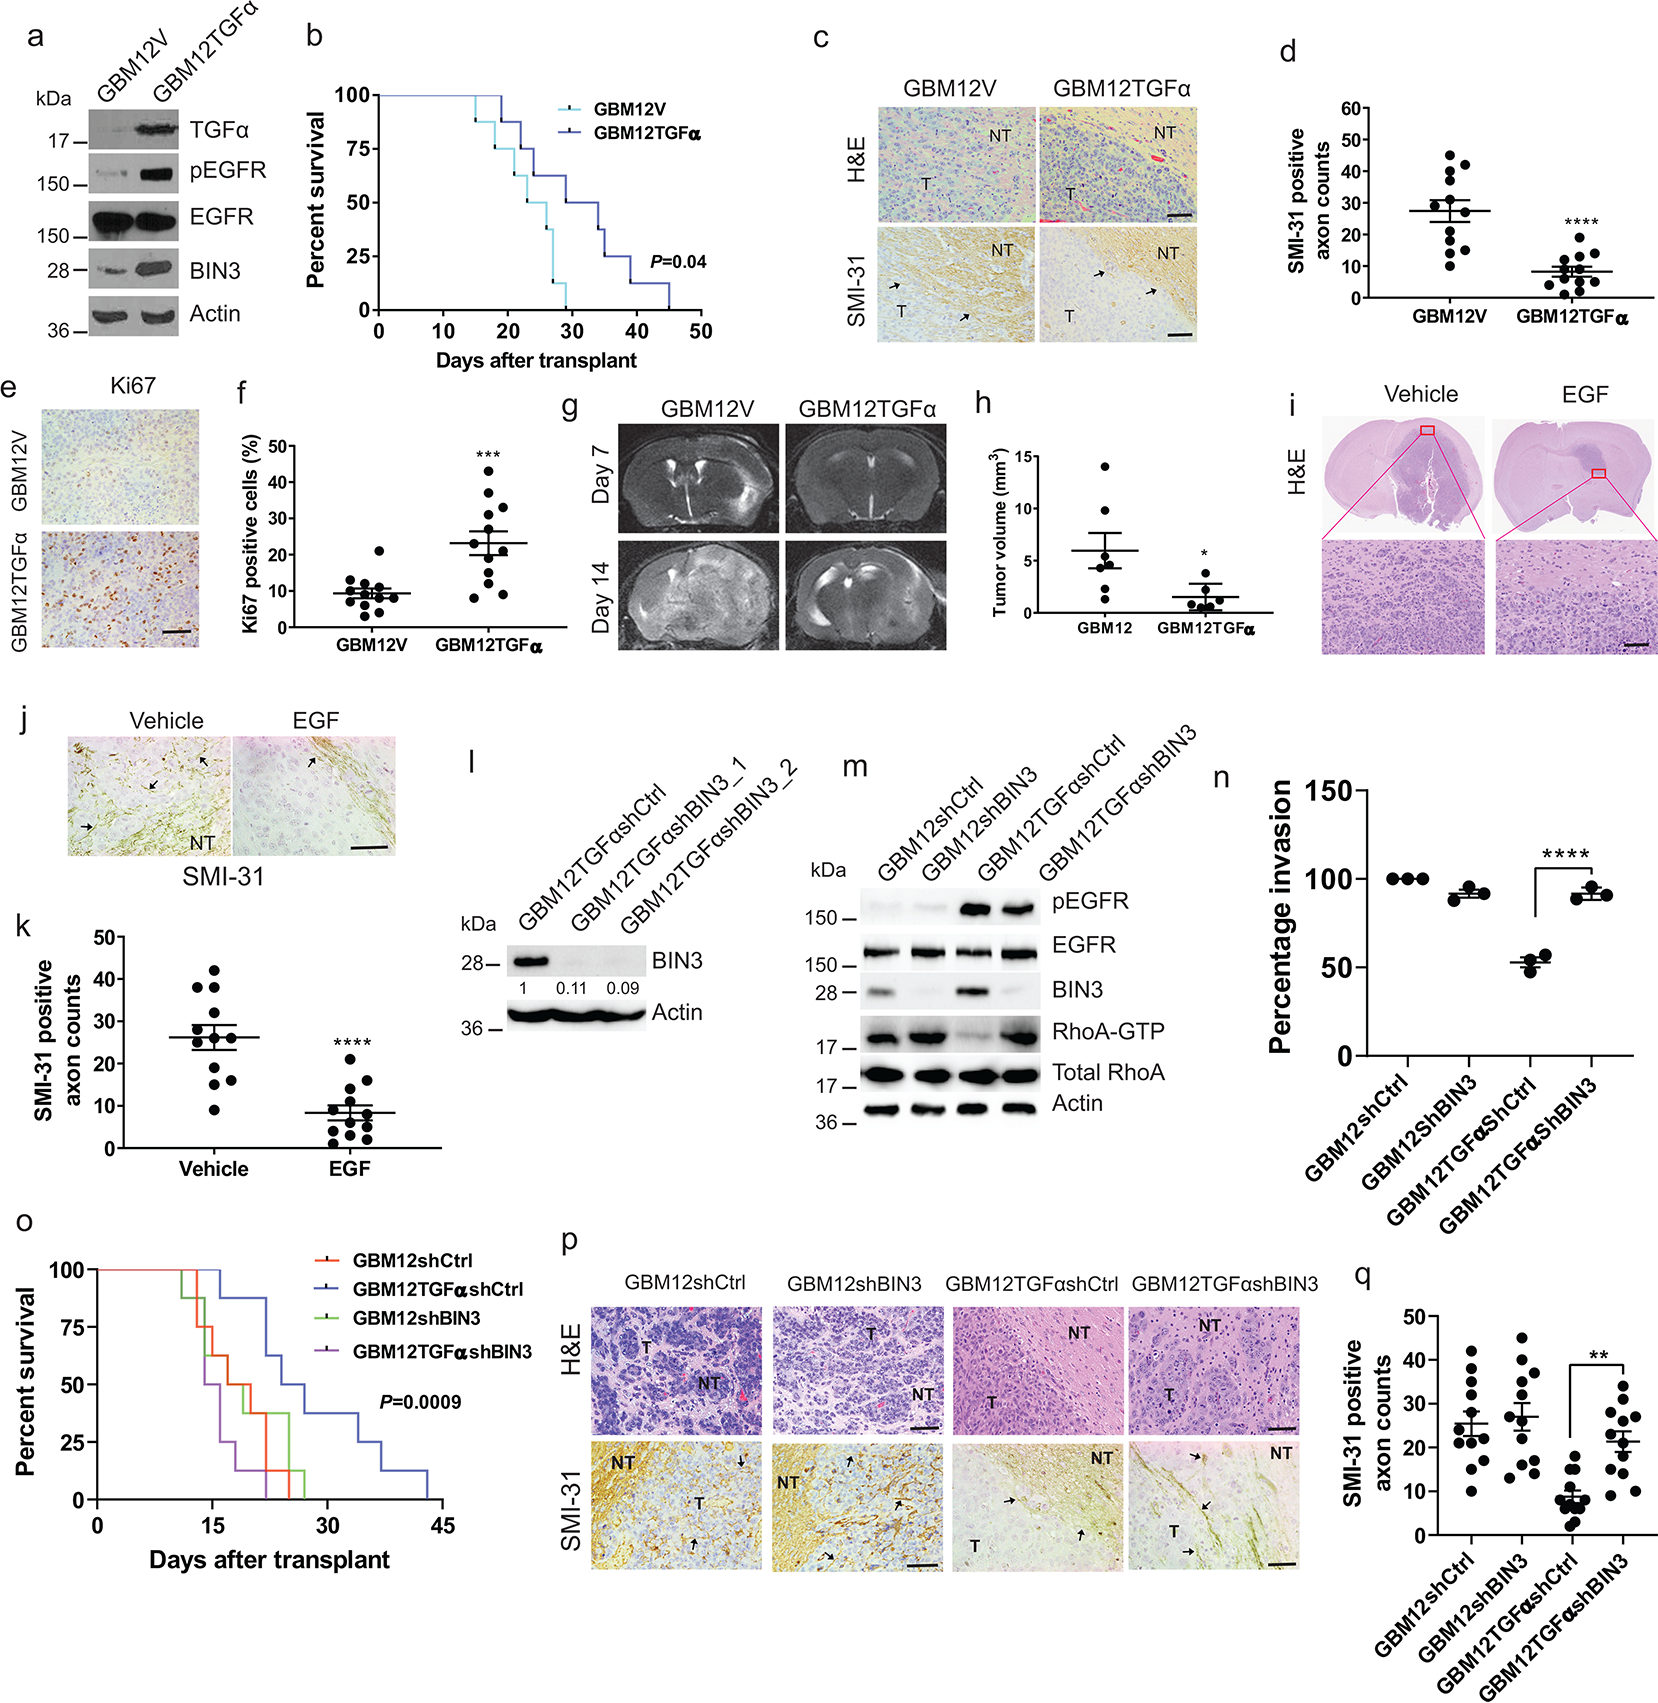
a, Immunoblot of the indicated proteins in GBM12 stably transfected with empty (GBM12V) or TGFα expression vector (GBM12TGFα). b, Kaplan–Meier survival curves of mice with orthotopic xenotransplant model of GBM12TGFα and GBM12V (n=8/group). c, Representative H&E staining and SMI-31 immunostaining in GBM12V and GBM12TGFα tumour tissue sections. T: Tumour; NT: Normal tissue. d, Quantification of SMI-31 counts within tumour region. e-f, Representative images and quantification of Ki67 immunostaining in mouse tumour tissue sections. g, Representative MRI imaging of orthotopic tumour bearing mice obtained at 7 and 14 days after transplantation of GBM12V or GBM12TGFα. h, Tumour volume of two groups after 14 days (GBM12V n=7, GBM12TGFα n=6). i, H&E staining of GBM12 orthotopic tumours from mice intracranially infused with EGF or vehicle (n=4/group). j-k, Representative immunostaining and quantification for SMI-31 in GBM12 orthotopic tumours from mice treated with vehicle or EGF. l, Immunoblot of BIN3 in GBM12TGFα stably transfected with control or BIN3 shRNA. m, Immunblot of the indicated proteins in the indicated cells. n, Matrigel invasion assay of multiple lines. o, Kaplan–Meier survival curves of orthotopic mouse xenotransplant model of the indicated cells (n=8/group). p, Representative H&E staining and SMI-31 immunostaining in tumour tissue sections. q, Quantification of SMI-31 counts. The Western blot images are representative of three independent biological replicates. Actin served as the loading control. The numbers below the blots indicate the relative band intensity of protein against that of Actin. Scale bar: 100 μm. Data are represented as mean ± SEM from three independent experiments. Statistical significance was determined by log-rank test (b, o), or by two-tailed unpaired Student’s t-test (d, f, h, k), or by two-way ANOVA adjusted by Bonferroni’s correction (n, q). *P <0.05, **P < 0.01, ***P < 0.001, ****P < 0.001, n.s. not significant. Numerical source data, statistic, exact P values and unprocessed blots are available as Source Data.