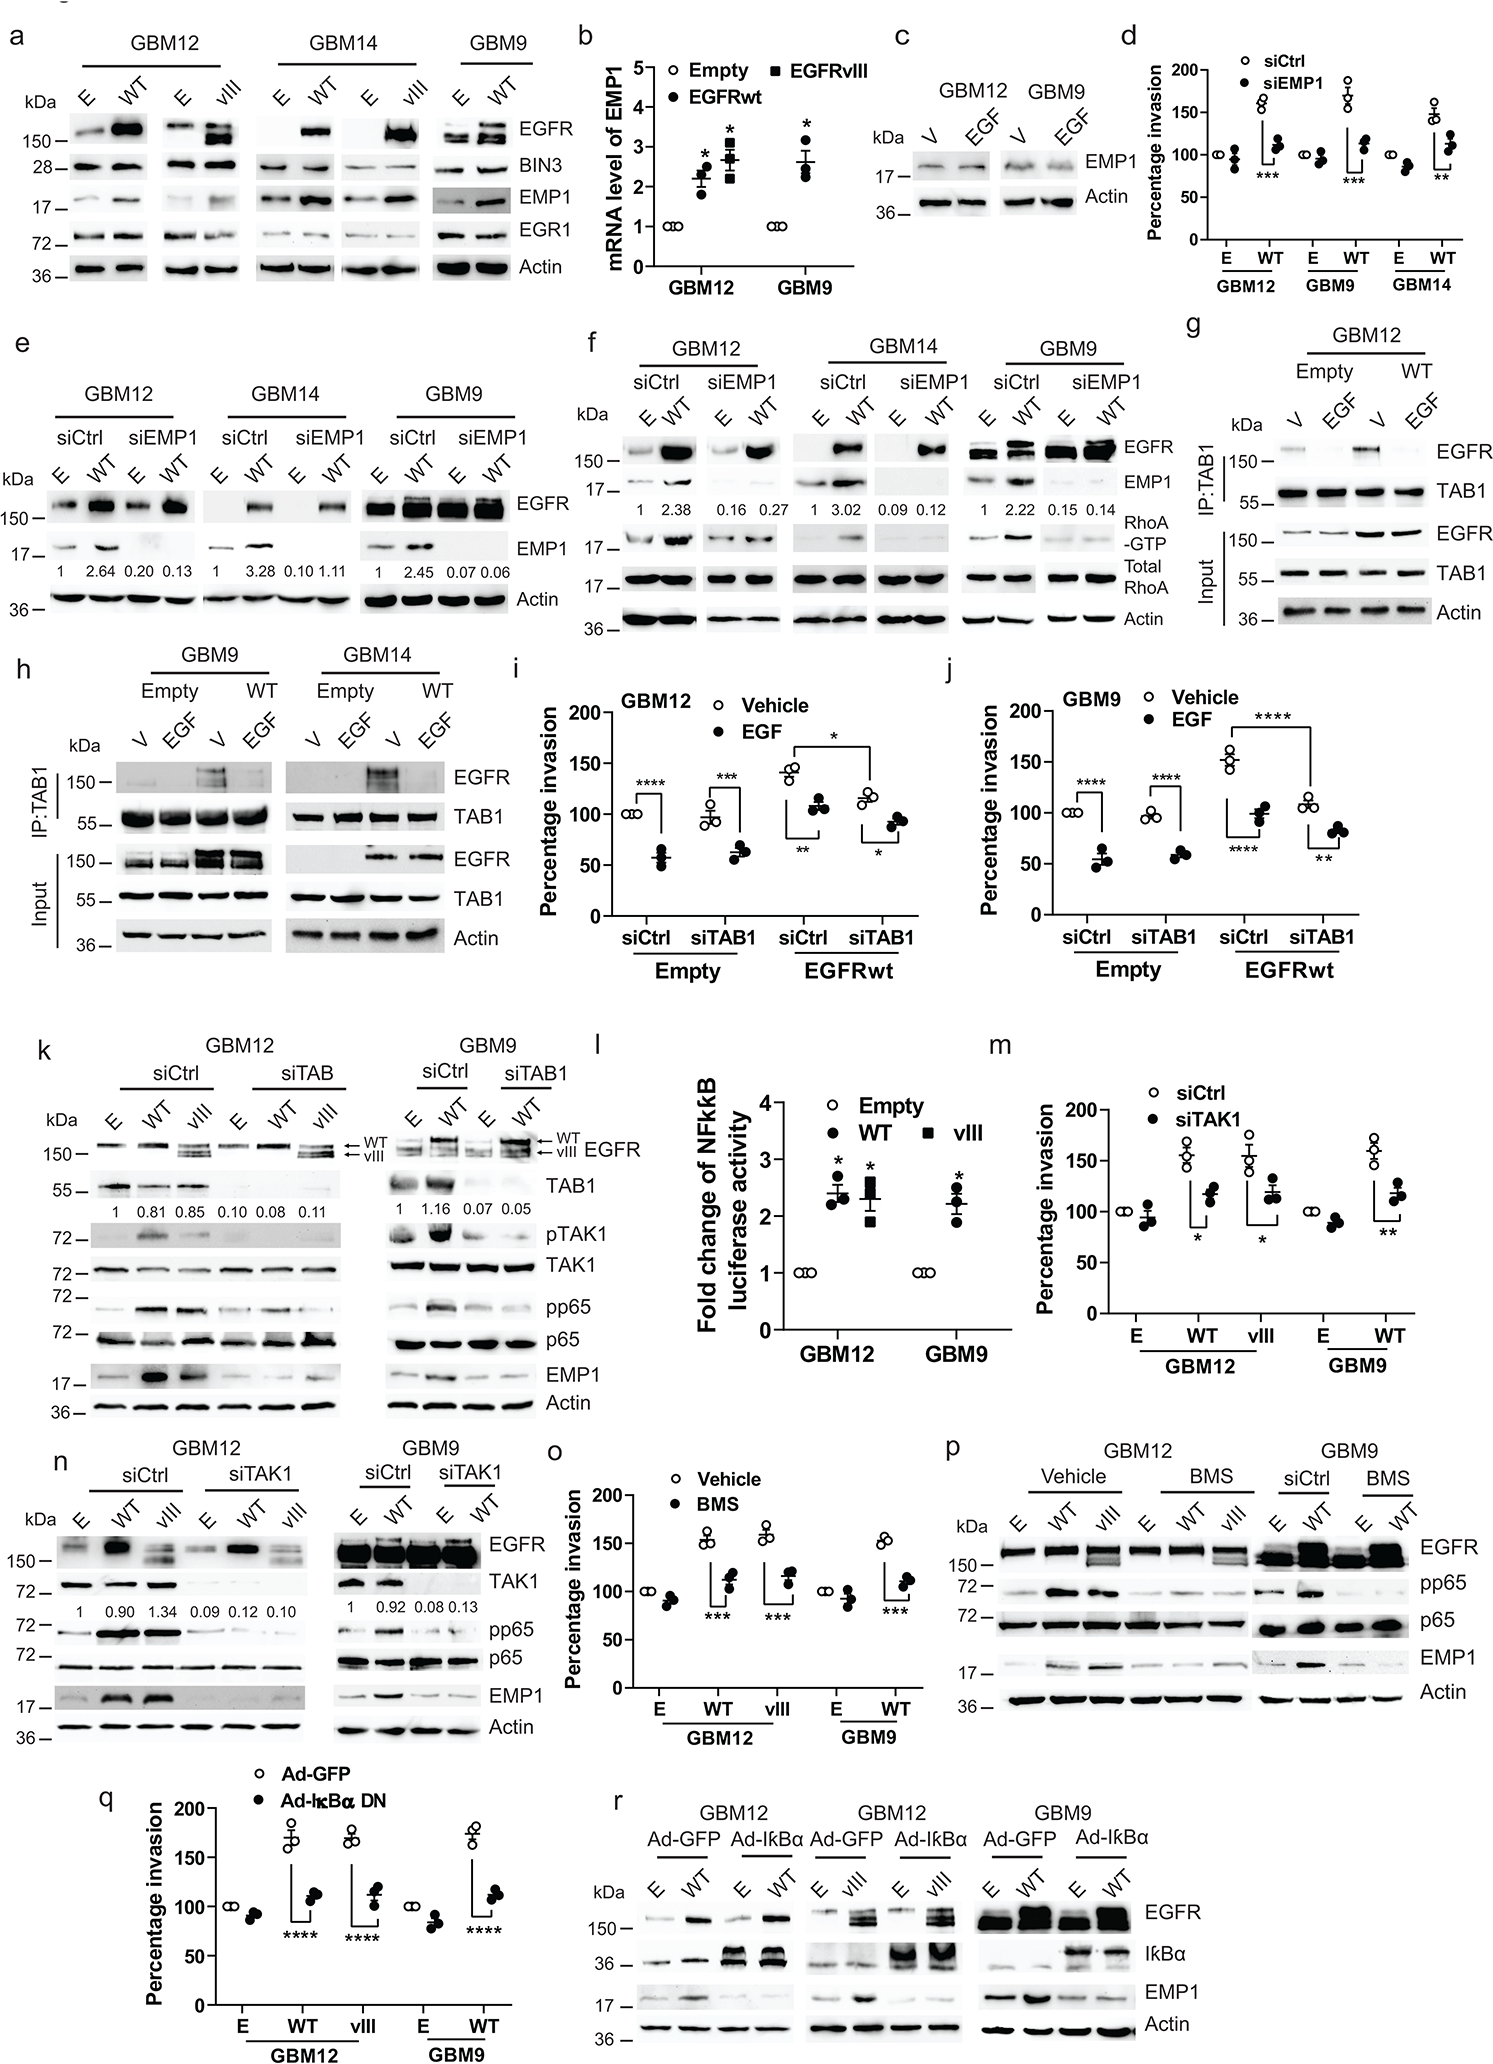
Figure 5. Constitutive EGFR signaling induces TAB1-TAK1-p65-EMP1 pathway.

a, Immunoblot of the indicated proteins in cells transiently transfected with empty (E), EGFRwt (WT) or EGFRvIII (vIII) expression vectors. b, mRNA level of EMP1 in cells transiently transfected with empty, EGFRwt or vIII expression vectors. c, Immunoblot of EMP1 protein expression in cells treated with EGF (50 ng/ml) for 24 hours. d, Matrigel invasion of multiple lines transiently transfected with empty or EGFRwt expression vectors, along with control or EMP1 siRNA. e, Efficiency of EMP1 knockdown and EGFRwt overexpression was analyzed by Western blot. f, Immunoblot of the indicated proteins in multiple lines transiently transfected with empty or EGFRwt expression vectors, along with control or EMP1 siRNA. g-h, Immunoblot of immunoprecipitated extracts from EGFRwt overexpressing multiple lines treated with vehicle or EGF for 30 minutes. i-j, Matrigel invasion of EGFRwt or EGFRvIII overexpressing and/or TAB1 siRNA knockdown cells. k. Immunoblot of the indicated proteins in cells as described in i-j. l, NF-κB luciferase reporter activity in EGFRwt or EGFRvIII overexpressing cells. m, Matrigel invasion of EGFRwt or vIII overexpressing and/or TAK1 siRNA knockdown cells. n, Immunoblot of the indicated proteins in cells as described in m. o, Matrigel invasion of EGFRwt or EGFRvIII overexpressing cells treated with NF-κB inhibitor BMS (BMS-345541). p, Immunoblot of the indicated proteins in EGFRwt or vIII overexpressing cells treated with BMS for 48 hours. q, Matrigel invasion of EGFRwt or vIII and/or IκBα dominant negative (DM) overexpressing cells. r, Immunoblot of the indicated proteins in cells as described in q. Western blot images are representative of three independent biological replicates. Actin served as the loading control. The numbers below the blots indicate the relative band intensity of protein against that of actin. Data are represented as mean ± SEM from three independent experiments. Statistical significance was determined by two-tailed one-sample Student’s t-test (b, l), or by two-way ANOVA adjusted by Bonferroni’s correction (d, i, j, m, o, q). *P < 0.05, ** P < 0.01, *** P < 0.001, ****P < 0.0001. Numerical source data, statistic, exact P values and unprocessed blots are available as Source Data.
