
Figure 7. Tofacitinib prolongs survival, reduces invasiveness and increases proliferation in an orthotopic glioblastoma mouse model.
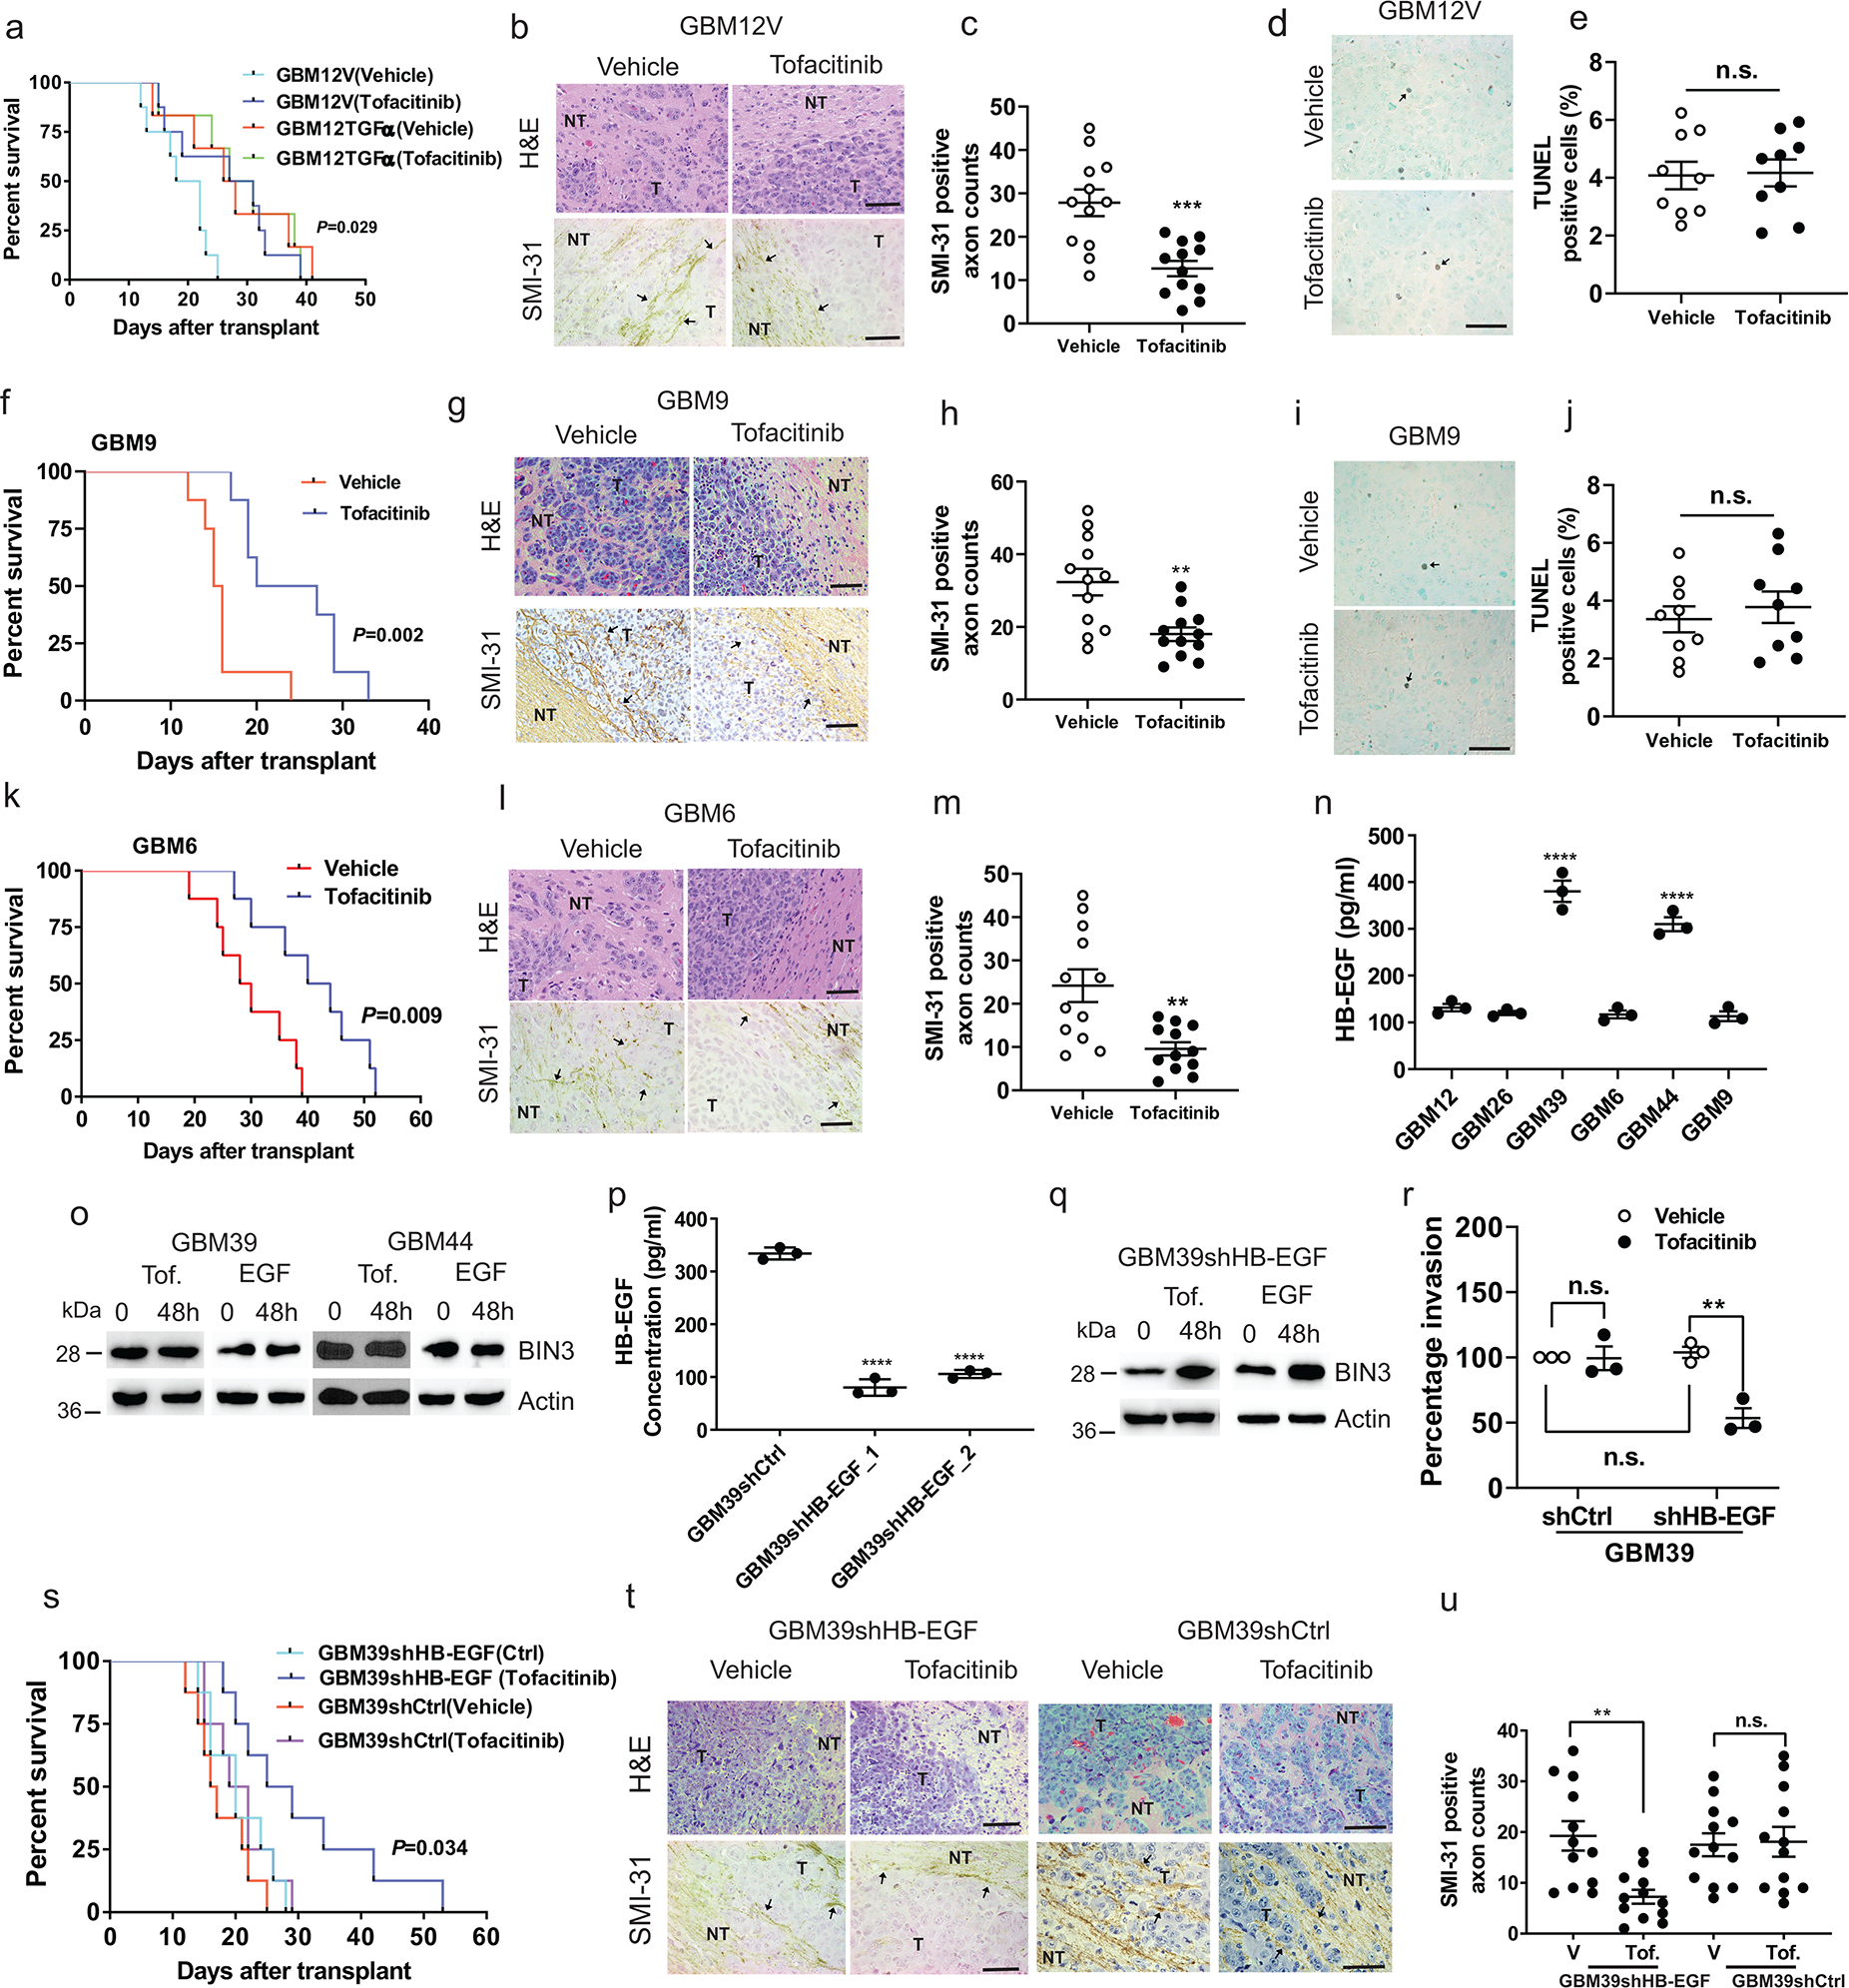
a, Kaplan–Meier survival curves of mice in an orthotopic model of GBM12V and GBM12TGFα treated with vehicle or tofacitinib (50 mg/kg) (n=8 for GBM12TGFα, n=6 for GBM12V). P-value represents vehicle vs. tofacitinib in GBM12TGFα groups. b-c, H&E staining, SMI-31 immunostaining (black arrows) and quantification of SMI-31 counts in GBM12V orthotopic tumours. d-e, TUNEL staining (black arrows) and quantification of TUNEL positive cells in GBM12V orthotropic tumour from vehicle and tofacitinib treated mice. f, Kaplan–Meier survival curves of mice with orthotopic model of GBM9 treated with vehicle or tofacitinib. g-h, H&E staining, SMI-31 immunostaining and quantification of SMI-31 counts in GBM9 orthotopic tumours from vehicle and tofacitinib treated mice. i-j, TUNEL staining and quantification of TUNEL positive cells in a GBM9 orthotopic tumour. k, Kaplan–Meier survival curves of mice with an orthotopic model of GBM6 treated with vehicle or tofacitinib. l-m, H&E staining, SMI-31 immunostaining and quantification of SMI-31 counts in GBM6 orthotopic tumour. n, ELISA for HB-EGF in the supernatants of multiple lines. o, Immunoblot of BIN3 expression in cells treated with tofacitinib or EGF. p, Knockdown efficiency of HB-EGF in GBM39 control shRNA and HB-EGF shRNA clones was confirmed by ELISA. q, Immunoblot of BIN3 expression in GBM39shHB-EGF (GBM39shHB-EGF_1) treated with either tofacitinib or EGF. r, Matrigel invasion assay of the inciated cells in the presence or absence of tofacitinib. s, Kaplan–Meier survival curves of mice with orthotopic models of GBM39shCtrl and GBM39shHB-EGF treated with vehicle or tofacitinib (n=8/group). t-u, H&E staining, SMI-31 immunostaining and quantification of SMI-31 counts in GBM39shHB-EGF and GBM39shCtrl orthotopic tumours from vehicle and tofacitinib treated mice. The Western blot images are representative of three independent biological replicates. Actin served as the loading control. Scale bars: 50 μM. Data are represented as mean ± SEM from three independent experiments. Statistical significance was determined by log-rank test (a, f, k, s), or by two-tailed unpaired Student’s t-test (c, e, h, j, m, u), or by one-way ANOVA adjusted by Bonferroni’s correction (n, p), or by two-way ANOVA adjusted by Bonferroni’s correction (r). *P <0.05, **P < 0.01, ***P < 0.001, ****P < 0.001, n.s. not significant. Numerical source data, statistic, exact P values and unprocessed blots are available as Source Data.