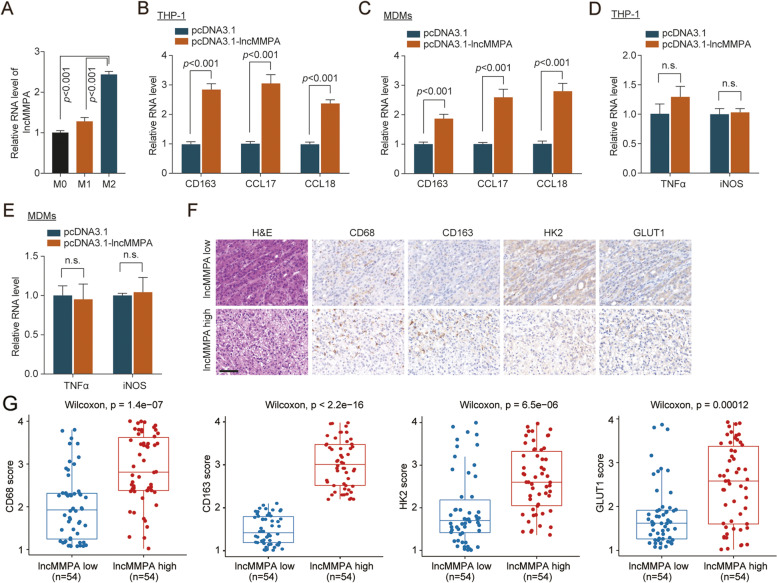
Fig. 2.
RP11-1100 L3.8 lncRNA induces M2 macrophage polarization. A The expression level of LncMMPA in M0, M1 and M2 macrophages derived from monocyte cells was normalized to that of actin gene and shown as a ratio relative to the expression level in the M0 macrophages. B The expression level of M2 macrophages markers (CD163, CCL17 and CCL18) in THP-1 cells with lncMMPA overexpression was normalized to that of actin gene and shown as a ratio relative to the expression level in THP-1 cells with pcDNA3.1 transfection. C The expression level of M2 macrophages markers (CD163, CCL17 and CCL18) in MDMs cells with lncMMPA overexpression was normalized to that of actin gene and shown as a ratio relative to the expression level in MDMs with pcDNA3.1 transfection. D The expression level of M1 macrophages markers (TNFα and iNOS) in THP-1 cells with lncMMPA overexpression was normalized to that of actin gene and shown as a ratio relative to the expression level in THP-1 cells with pcDNA3.1 transfection. E The expression level of M1 macrophages markers (TNFα and iNOS) in MDMs cells with lncMMPA overexpression was normalized to that of actin gene and shown as a ratio relative to the expression level in MDMs with pcDNA3.1 transfection. F Representative hematoxylin and eosin (H&E) and immunohistochemical (IHC) staining for CD68, CD163, GLUT1 and HK2 in HCC cancer samples with lncMMPA low or high expression level of ZSHS cohort 1; n = 108. Scale bar, 50 μm. G Boxplot show the IHC staining of CD68, CD163, GLUT1 and HK2 in lncMMPA low and high expression HCC tissue of ZSHS cohort 1; n = 108

