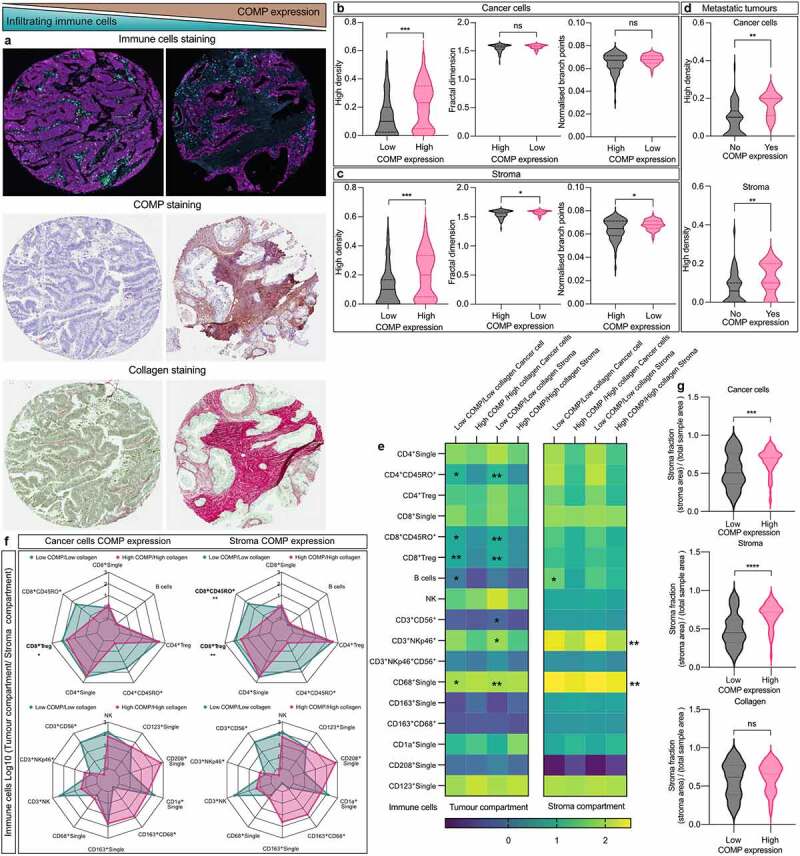
Figure 4.

High levels of COMP expression correlate with increased collagen deposits in the stroma. (a) Representative TMAs stained for immune cells, COMP expression and collagen. Collagen deposition was detected using Sirius red staining (red). (b) Collagen characteristics were evaluated with a Fiji macro TWOMBLI. Expression of COMP (score 0–2 vs 2–3) from the cancer cells correlated with higher density of collagen fibers. (c) High stroma deposition of COMP (score 0–2 vs 2–3) correlated with high density, fractal dimension and branch points of collagen fibers. (d) In the metastatic tumors, the positive staining of COMP (score 0 vs 1–3) in the cancer cells or stroma correlated with higher collagen density. Patients were stratified into in two groups based on COMP and collagen levels (low COMP expression/low collagen density and high COMP expression/high collagen density). (e) Correlation between the two aforementioned groups and density of immune cell infiltration. (f) Tumor to stroma ratios were estimated for infiltrating immune cells and correlated with the aforementioned groups. (g) High COMP expression by the cancer cells or in stroma is correlated with larger fraction of stroma. Non-parametric Mann–Whitney two-tailed exact p-value used for plots B, C and D. Spearman’s non-parametric correlation analyses was used for plot E (*<0.05, **<0.01, ***<0.001, ****<0.0001).
