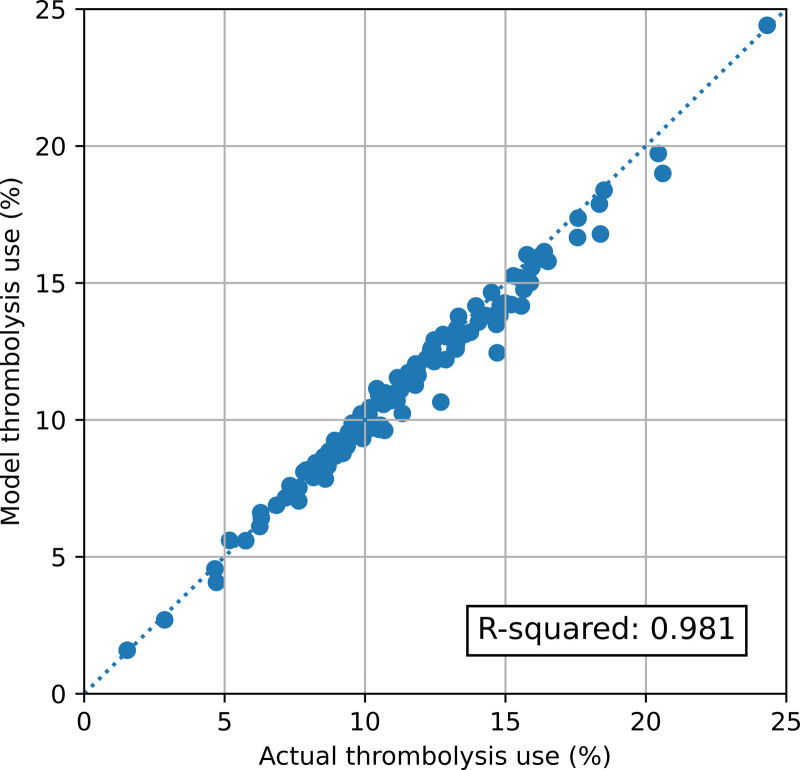
Figure 3.
Validation of the stroke thrombolysis pathway model. The x axis shows the actual thrombolysis use in each hospital (for patients with an out-of-hospital onset stroke), and the y axis shows the thrombolysis use predicted from the pathway model. Model parameters were based on pathway statistics for each hospital. The dotted line shows a 1:1 correlation between actual and predicted values.

