
Figure 4.
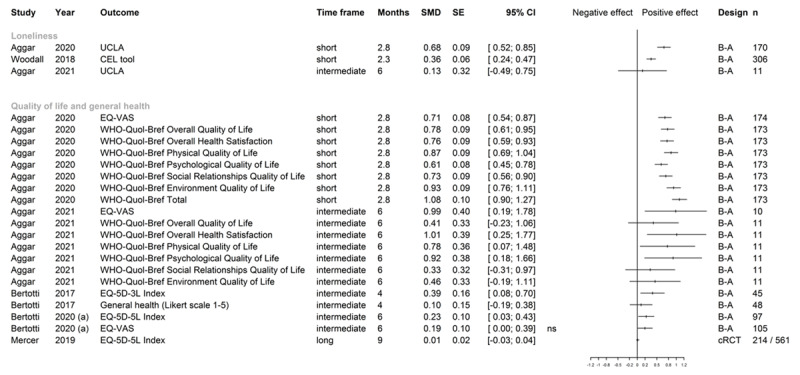
Effect sizes for loneliness, quality of life, and general health.
Note: UCLA University of California Los Angeles Loneliness Scale; CEL Campaign to End Loneliness ; EQ-VAS European Quality of Life Visual Analogue Scale; WHO-Quol-Bref, WHO Quality of Life short form; EQ-5D-3L/5L European Quality of Life 5 Dimensions 3 Level/5 Level; Time frame: short (0–3 months), intermediate (>3–6 months) and long term (>6 months); Follow-up time in months: in case of original study reporting follow-up in weeks, these were converted to 30-day months; B-A before-after study; cRCT cluster randomized controlled trial; n number of patients analyzed for outcome, numbers refer to intervention/control in case of controlled studies; SMD and SE rounded by software package to two digits, confidence intervals were calculated by R package “meta” [37] from SMD/SE values calculated by R package “effect size” [35]. In cases of 0.00 as a confidence interval bound, the graph shows whether the original study reported a significant (s) or non-significant (ns) result, as the plotting function only shows two digits. For Mercer 2019 [92,93], effect sizes were taken from the original publication (adjusted SMD).