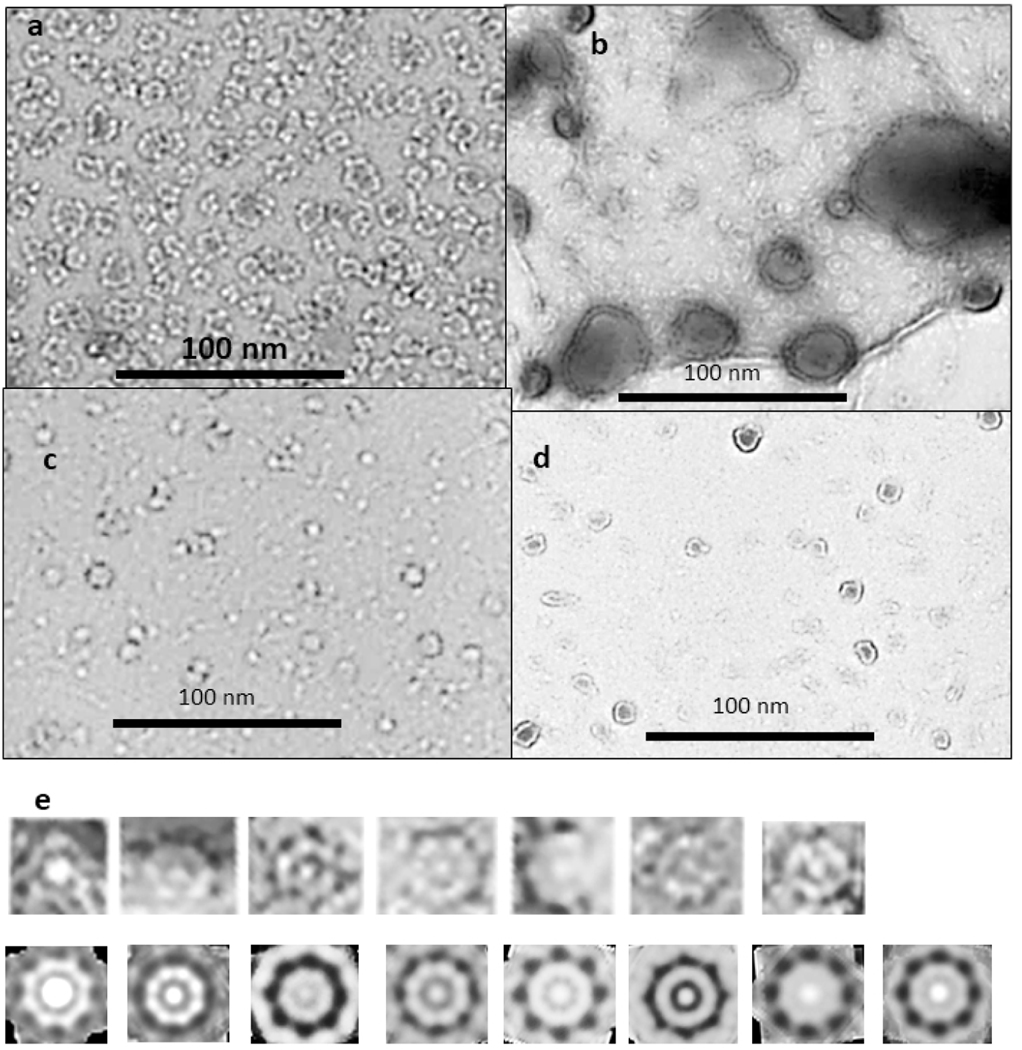
Figure 1.
Negative stained EM images of beaded (a) and smooth (b, c, & d) APFs (originals provided by Rakez Kayed). See50 for methods. (e) Example of how averaged images were developed. These images are from the micrograph shown in (b) for one size of WCsAPF that has 8-fold radial symmetry. Images of individual APFs were copied into Photoshop and intensity and contrast were adjusted to make their characteristics more visible (top row). Radial image averaging should be used cautiously because it can produce the appearance of radial symmetry even when none exists. Unaveraged images are shown to illustrate that some WCsAPFs, especially the larger ones, exhibit radial symmetry without radial averaging. Each of these was averaged with radial symmetry (bottom row). All radially averaged images of similar size and symmetry were aligned and averaged to obtain the final image for each specific sAPF (last image of the bottom row).

