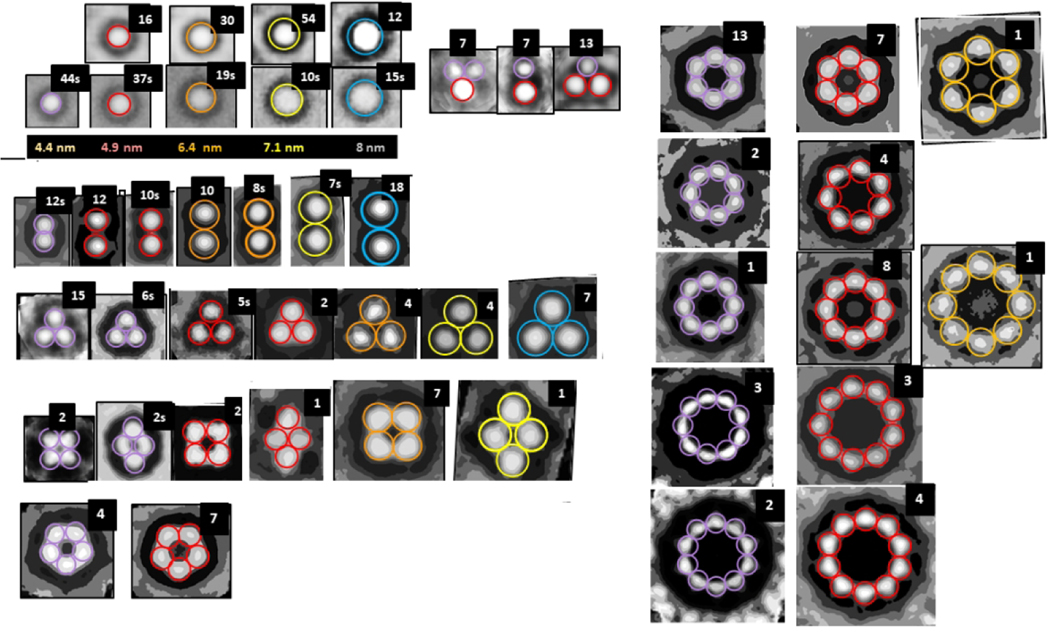
Figure 2.
Averaged images of isolated and symmetric assemblies of beads (oligomers). The colored circles have the diameters indicated below the second row. The number of images used to develop the averaged images is in the upper right corner; when followed by a “S” the images were made from one of the sAPF micrographs. There appears to be five sizes of beads with diameters ranging from about 4 to 8 nm. The first two rows on the left-half show isolated beads from both types of micrographs followed by three examples of small clusters composed of the two smallest-size beads. The remaining rows shows symmetric assemblies composed of 2 to 10 beads. Beads within each illustrated bAPF all have the same size, but the bead size varies among bAPFs that have the same number of beads. The two smallest sizes occur most often for bAPFs with five or more beads. The “cutout” facility of Photoshop was applied to most images to help identify centers of the beads.

