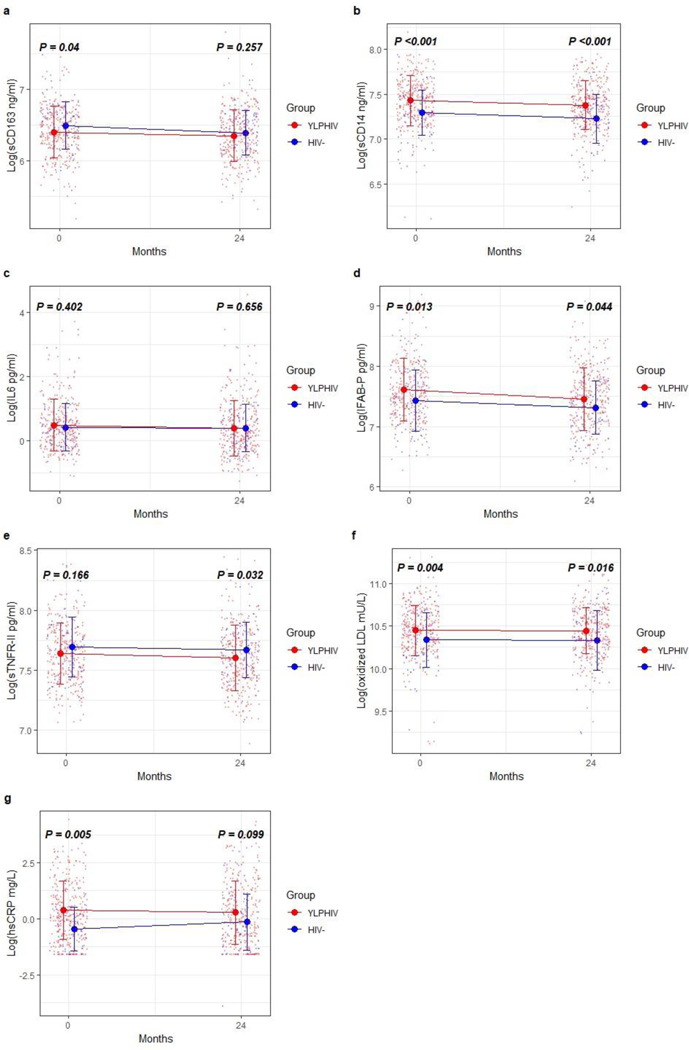
Fig. 1.
Changes in biomarkers between the groups at baseline and 24 months. Graph showing median biomarkers with whiskers representing interquartile range, and the colored small dots are all values (a: soluble CD163, b: soluble CD14, c: IL-6, d: intestinal fatty acid binding protein, e: soluble tumor necrosis factor receptor a II, f: oxidized LDL, g: high sensitivity C-reactive protein) in youth living with perinatally acquired HIV and HIV at enrollment and 24 months. Biomarkers were log transformed. Wilcoxon test used, P values represent differences between youth living with perinatally acquired HIV and HIV at each time point. hsCRP, high sensitivity C-reactive protein; IFAB-P, intestinal fatty acid binding protein; IL-6, interleukin 6; sCD14 and 163, soluble CD14 and 163; sTNFRII, soluble tumor necrosis factor receptor a II.

