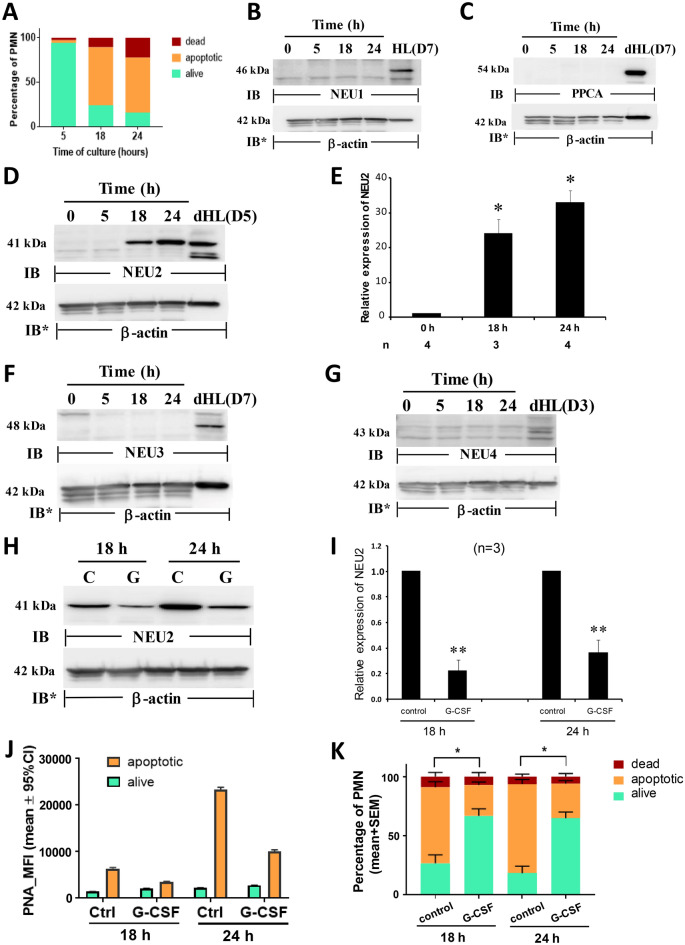
Figure 2.
NEU2 Protein Expression in Proapoptotic PMNs. Purified human PMNs were cultured in RPMI 1640 with 10% FBS for 5, 18 or 24 h, after which the cells were assayed for viability and apoptosis (A) or lysed and the lysates, at 50 µg total cellular protein/lane, were processed for NEU1 (B), PPCA (C), NEU2 (D), NEU3 (F), and NEU4 (G) immunoblotting. To control for protein loading and transfer, blots were stripped and reprobed for β-actin. IB, immunoblot; IB*, immunoblot after stripping. MW in kDa indicated on left. (E) densitometric analyses of the blots in (D). Vertical bars represent mean ± SE NEU2 signal normalized to β-actin signal in the same lane on the same stripped and reprobed blot. *, increased normalized NEU2 signal compared to that seen at time 0. (H) PMNs were cultured for 18 h and 24 h, in the presence of human rG-CSF 10 ng/ml or medium alone, after which the cells were lysed and the lysates, at 50 µg total cellular protein/lane, were processed for NEU2 immunoblotting. To control for protein loading and transfer, blots were stripped and reprobed for β-actin. IB, immunoblot; IB* immunoblot after stripping. MW in kDa is indicated on the left. (I) Densitometric analyses of the blots in H. Vertical bars represent mean ± SE NEU2 signal normalized to β-actin signal in the same lane on the same stripped and reprobed blot. **, decreased normalized NEU2 signal compared to that seen in the absence of G-CSF treatment at p < 0.05. (J) PMNs were cultured for 18 h or 24 h in the presence of human rG-CSF or medium alone, after which they were subjected to flow cytometry to determine their viability or whether they had undergone apoptosis and PNA lectin flow cytometry to assess their surface desialylation. Vertical bars represent mean PNA MFI. (K) PMNs cultured for 18 h and 24 h, in the presence of G-CSF or medium alone, were assayed for viability and apoptosis. The data generated in each panel represents experiments performed on ≥ 2 independent occasions. Cropped immunoblot images are shown.

