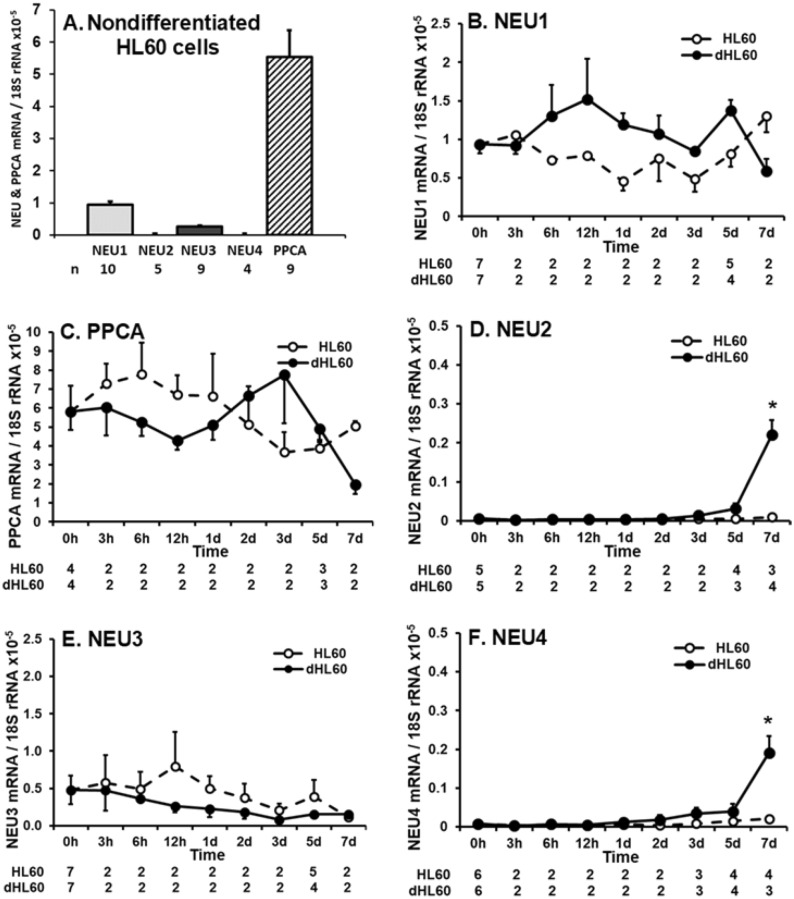
Figure 4.
NEU and PPCA Gene Expression During HL60 Cell Differentiation. (A) Total RNA isolated from nondifferentiated HL60 cells was processed for qRT-PCR for mRNA levels for NEU1-4 and PPCA, and normalized to the 18S rRNA control. (B–F) Total RNA isolated from HL60 cells cultured for increasing times in the presence of DMF or medium alone was processed for qRT-PCR to quantify mRNA levels for NEU1 (B), PPCA (C), NEU2 (D), NEU3 (E), and NEU4 (F), and each normalized to the 18S rRNA control. The n for each data point is indicated below each vertical bar (A) or time point (B–F). Each vertical bar (A) or symbol (B–F) represents mean ± SE normalized mRNA levels. The data generated in each panel represents experiments performed on ≥ 2 independent occasions. *, increased normalized NEU2/4 mRNA expression compared to nondifferentiated cells at p < 0.05.

