
FIGURE 4.
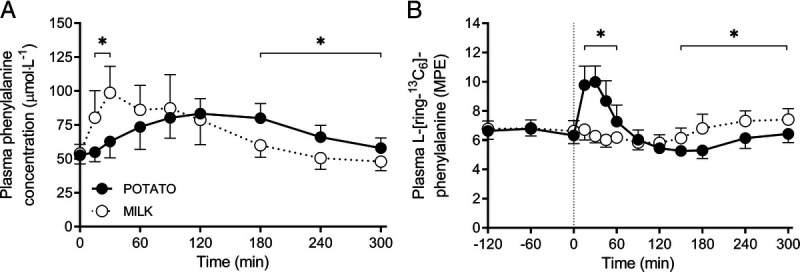
Postprandial plasma phenylalanine concentrations (A) and plasma l-[ring-13C6]-phenylalanine enrichments (B) during the 300-min period after the ingestion of POTATO vs MILK in healthy, young males (n = 12 per group). Time 0 min represents time of protein ingestion. POTATO: 30 g potato protein; MILK: 30 g milk protein. Values represent mean ± SD. *Significantly different for MILK vs WHEAT (P < 0.05). Repeated-measures ANOVA with time as within-subject variable and interventional drink (treatment) as between-subject variable. Time–treatment, P < 0.001 (A), P < 0.001 (B).