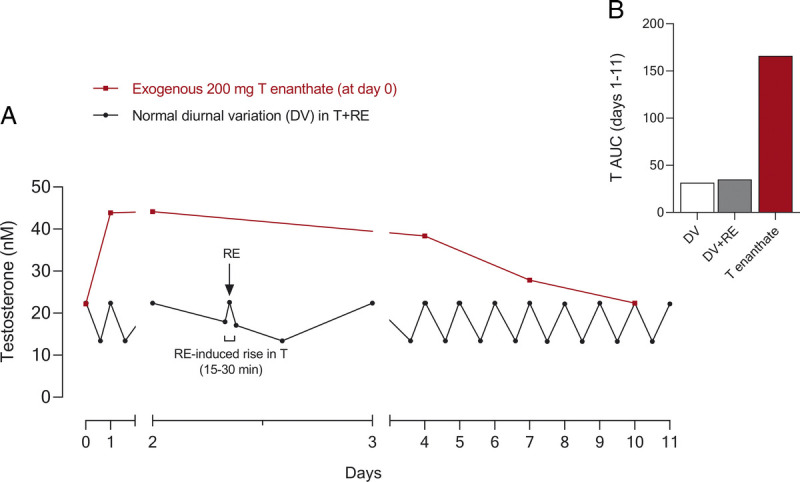
FIGURE 4.

A comparison of the changes in exogenous vs endogenous testosterone in serum. A, Schematic of the circadian changes of serum testosterone throughout 11 d showing the effect of one bout of RE in healthy young men (RE-induced ~30 min testosterone peak; based on data from Willoughby and Taylor [87]). In addition, a representation of the effect of an intramuscular testosterone injection (200 mg testosterone enanthate) vs a schematic of the normal diurnal variation in testosterone concentrations throughout a given week (based on data from Dobs et al. (88)). B, Cumulative AUC of serum testosterone over the first 7 d comparing 1) DV changes, 2) DV + 1 bouts of RE, and 3) 200 mg T enanthate. The schematic is adapted (with permission) from Schroeder et al. (86). AUC, area under the curve; DV, diurnal variation; T, testosterone.
