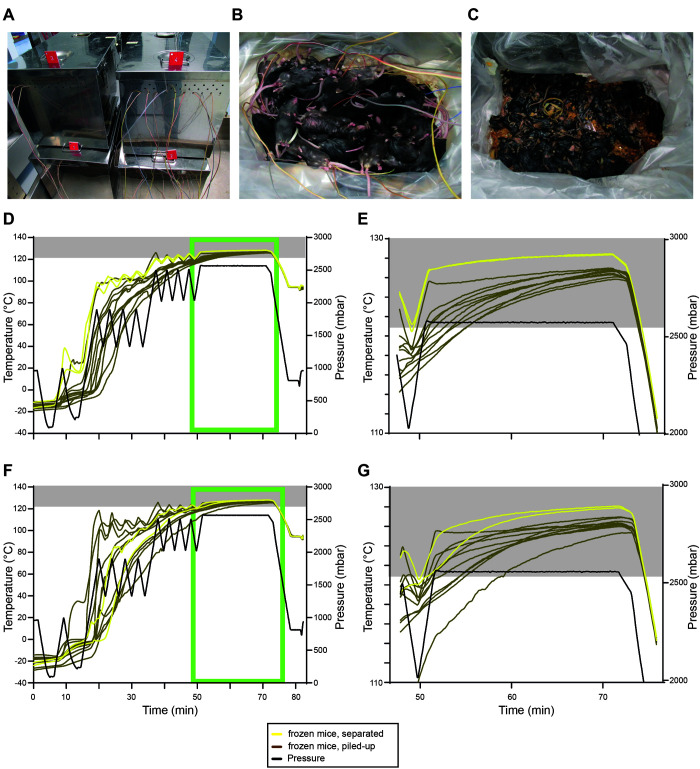
Figure 2.
Using the validated inactivation protocol for separately placed and piled-up thawed as well as frozen mice. (A) image showing the 4 steel containers with the different conditions run at the same time: no.1 - thawed separately placed; number 2 – thawed piled-up; no.3: frozen separately placed; number 4 frozen piled-up. B–C, images showing 50 thawed mice before (B) and after autoclaving (C). (D) temperature (°C, left) and pressure (mbar, right) profiles of the first run containing autoclave boxes with 10 separately placed frozen mice (yellow) and with 50 piled-up frozen mice (brown). (E) zoom-in image of the temperature profile of D (light green box). (F) temperature (°C, left) and pressure (mbar, right) profiles of the second run containing autoclave boxes with 10 separately placed frozen mice (yellow) and with 50 piled-up frozen mice (brown). (G) zoom-in image of the temperature profile of F (light green box). Gray boxes indicate temperatures ≥ 121°C.

