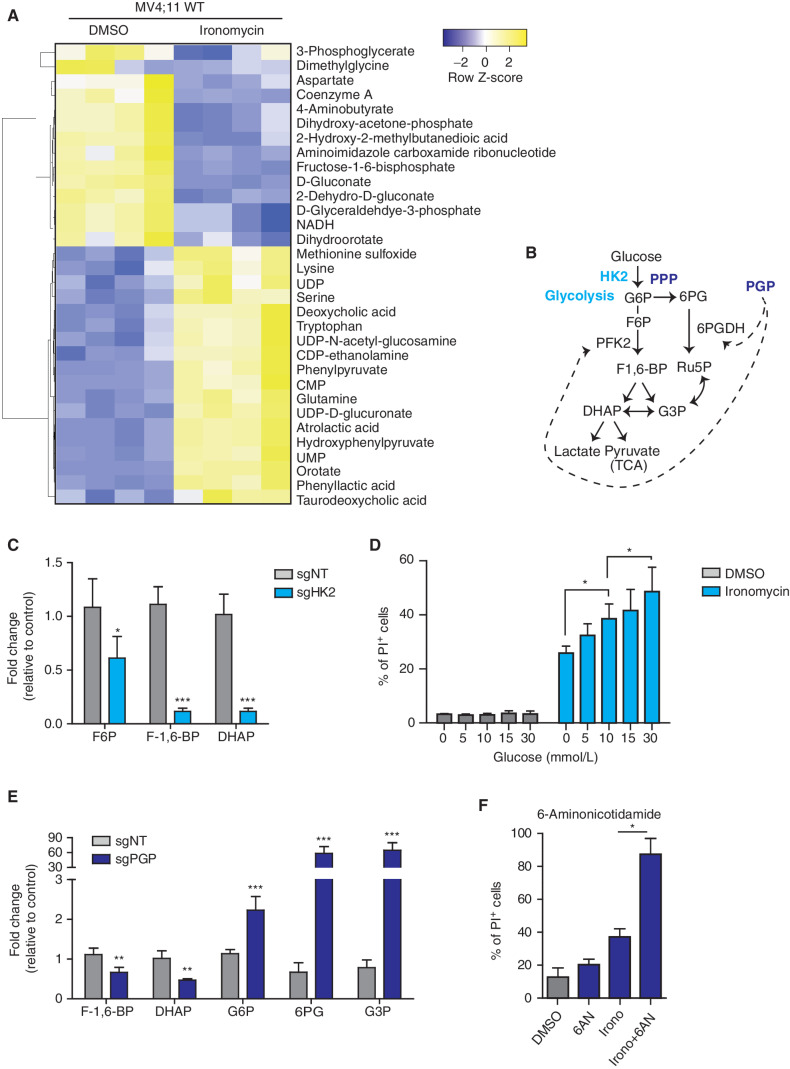
Figure 3.
Metabolic remodeling to reduce glycolytic flux and mitochondrial respiration protects against ironomycin. A, Heat map showing the differential abundance of metabolites in the MV4;11 WT cell line using mass spectrometry. We treated the cells with 500 nmol/L ironomycin or DMSO for 24 hours (n = 4 biological replicates). We selected the metabolites with a log2 fold change >1 and a t test P < 0.05. B, Schematic representation of glycolysis and the branched PPP and function of the two metabolic enzymes hexokinase 2 (HK2) and phosphoglycolate phosphatase (PGP). DHAP, dihydroxyacetone phosphate; F6P, fructose-6-phosphate; F-1,6-BP, fructose-1,6-bisphophate; G3P, glyceraldehyde-3-phosphate; Ru5P, ribulose-5-phosphate; 6PG, 6-phospho-D-glycerate; TCA, tricarboxylic acid cycle. C, Bar graph showing the changes in metabolites expression in the sgHK2 cell line using mass spectrometry (n = 4 biological replicates; means ± SD; *, P < 0.05; ***, P < 0.001). D, Proportion of cell death of ironomycin-treated MV4;11 cells cultured in various glucose concentrations. We performed flow-cytometry analysis using PI. Cells were treated with 500 nmol/L ironomycin for 48 hours in RPMI medium (n = 3 biological replicates; means ± SD; *, P < 0.05). E, Bar graph showing the changes in metabolite expression in the sgPGP cell line. Metabolites downstream phosphofructokinase 2 (PFK2) are decreased such as F-1,6-BP and DHAP. Metabolites upstream PFK2 are increased such as G6P, 6PG, and G3P (n = 3 biological replicates; means ± SD; **, P < 0.01; ***, P < 0.001). F, Proportion of cell death of ironomycin-treated cells in combination with the PPP inhibitor 6AN. We performed flow-cytometry analysis of PI fluorescence in MOLM-13. Cells were pretreated with 10 μmol/L 6AN for 30 minutes and treated with 500 nmol/L ironomycin for 48 hours (n = 3 biological replicates; means ± SD; *, P < 0.05).

