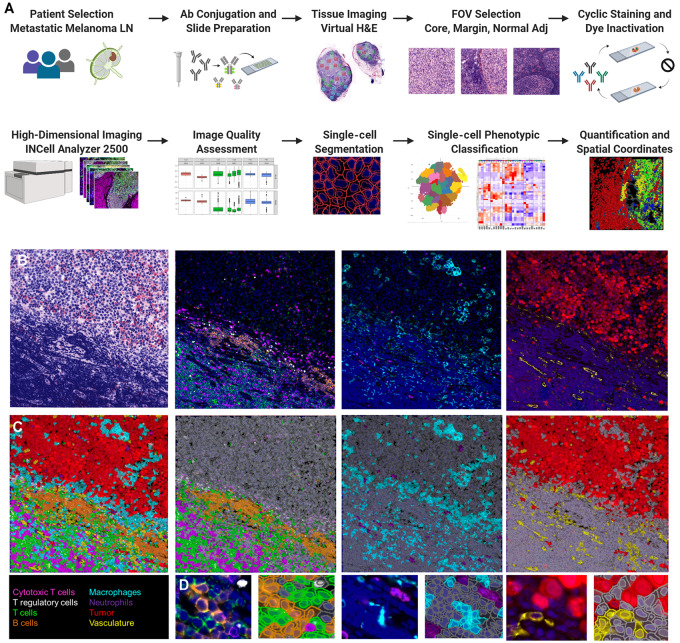
FIGURE 1.
MxIF study design and classification validation. Overview of MxIF workflow (A). Visual assessment of classification in QuPath (B–D). Virtual H&E of a tumor margin FOV and MxIF images visualizing the lymphocyte, myeloid, tumor, and vasculature components (B). Classification mask overlay for the composite image and cell classes (C). Inset images to show single-cell classification assignments.

