FIGURE 2.
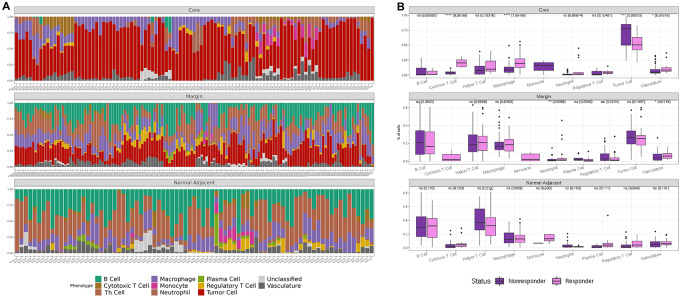
Single-cell composition of metastatic melanoma lymph node by anatomic subregion. Abundance plots of classified cells across all FOVs in tumor core, tumor margin, and normal adjacent lymphoid tissue (A). Statistical significance in abundances between cell types in responders and nonresponders (NR; n = 136 R FOVs, n = 193 NR FOVs; B).

