FIGURE 3.

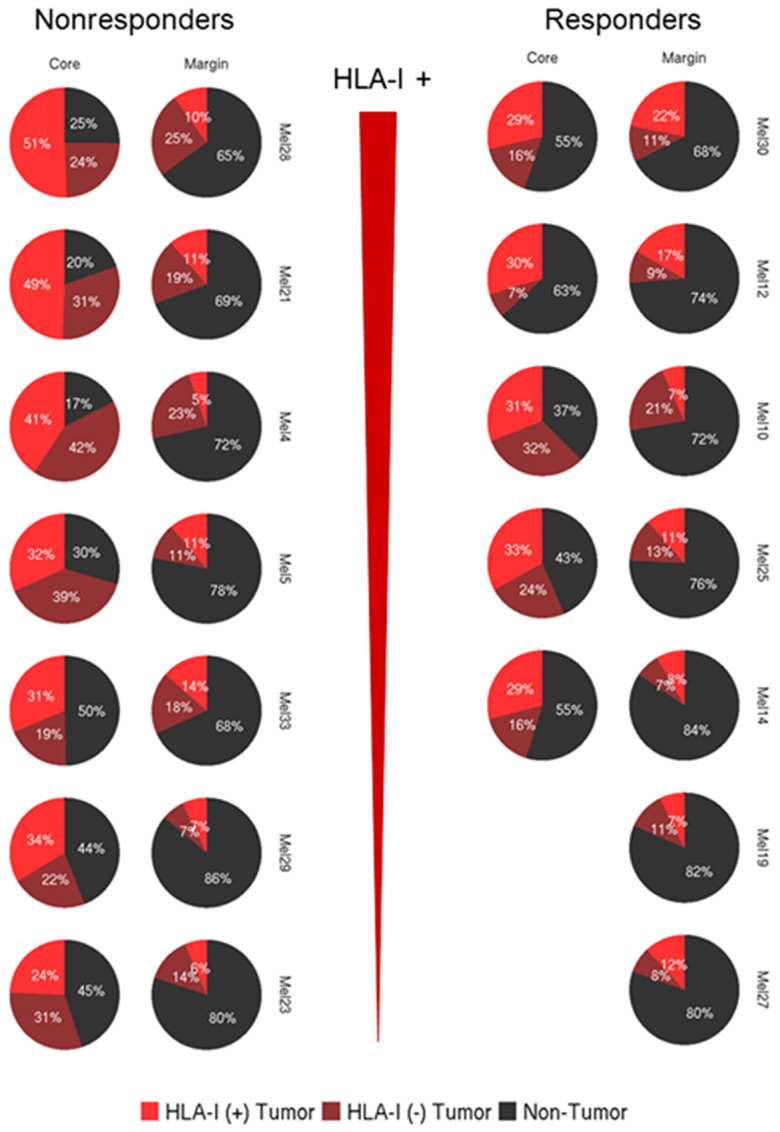
Single-cell expression of HLA-I on classified tumor cells. Proportion of classified tumor cells expressing HLA-I (bright red) versus no expression of HLA-I (dark red).

Single-cell expression of HLA-I on classified tumor cells. Proportion of classified tumor cells expressing HLA-I (bright red) versus no expression of HLA-I (dark red).