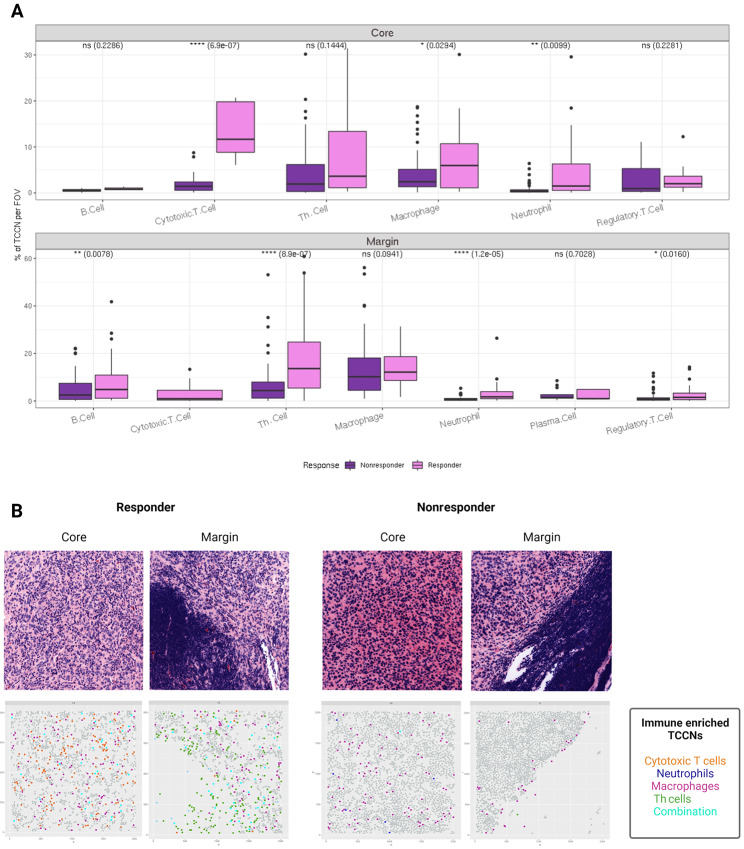
FIGURE 5.
TCCNs by anatomic subregion. Box plots of immune cell subsets populating TCCNs in the tumor core and tumor margin. Comparisons between responder and nonresponder TCCNs were compared using the Spearman correlation statistic (A). Virtual H&E and corresponding spatial plots visualizing TCCNs on the FOV colored on the basis of select immune cell subsets or a combination of immune cells in TCCNs of the tumor core and margin representing a responder and nonresponder (B). Figure created with Biorender.com.

