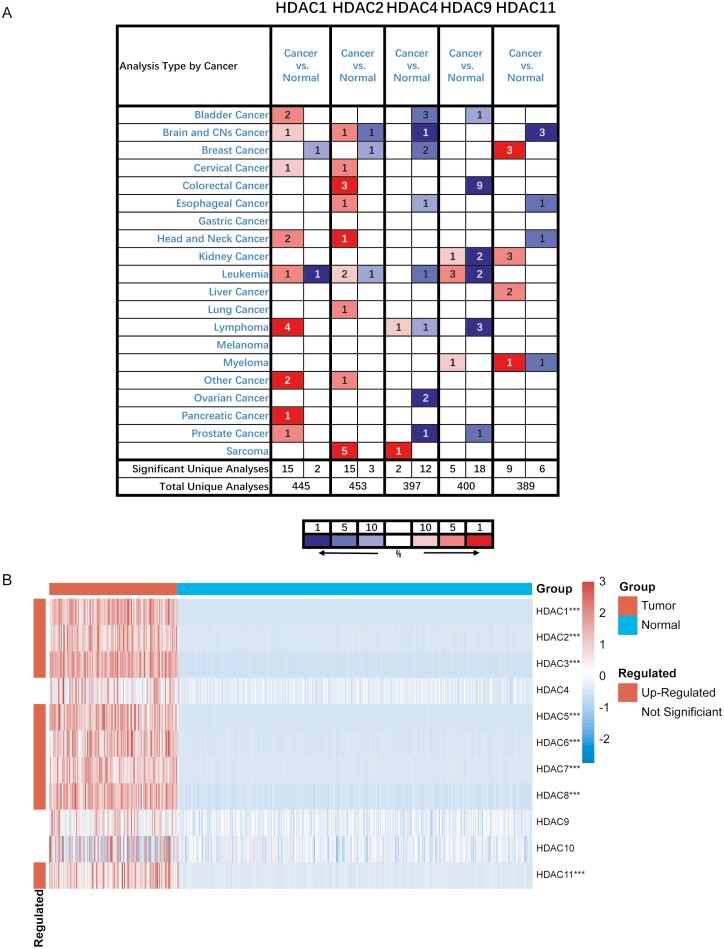
Figure 1:
HDAC gene family was extensively higher expressed in pan-cancer. A. The transcription expression level of HDAC gene family members was higher in most cancer types in Oncomine database. The numbers in the table represent the quantities of datasets with relatively higher expressed (red) or lower expressed (blue) of target genes. The following criteria were used: analysis type: cancer vs. normal tissue; P-value < 0.0001, fold change > 2, and gene rank= top 10%. B. HDAC1/2/3/5/6/7/8/11 was highly expressed in tumor compared to normal tissues in TCGA+GETx database in STS. All histological subtypes in TCGA cohort have been included in the analysis. Red squares indicate upregulated genes, blue squares indicate downregulated genes, and white squares indicate genes without difference. The P values were showed as: ***P < 0.001.

