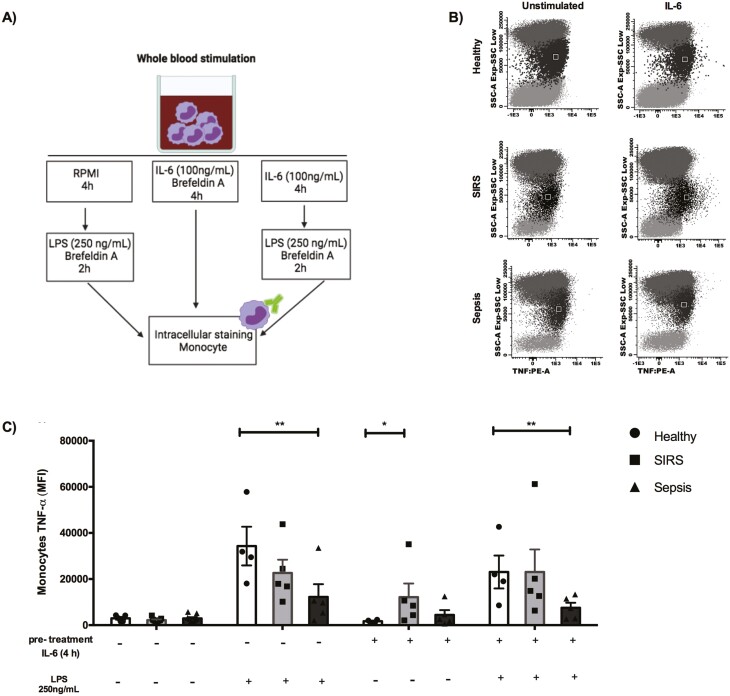
Figure 3:
IL-6-induced TNF-α is increased in monocytes from patients with SIRS. (A) Representation of the experimental conditions. (B) Dot plots representing TNF-α production in peripheral blood leukocytes from a healthy volunteer, a patient with SIRS and a patient with sepsis, with or without stimulation with IL-6 (100 ng/mL) for 4 h. The black region in the dot plots represents the monocytes (SSCmed). (C) Peripheral blood was cultured with RPMI alone, or with RPMI supplemented with IL-6 (100 ng/mL) and brefeldin A (5 μg/mL) for 4 h; with LPS (250 ng/mL) and brefeldin A (5 μg/mL) for 2 h; or with IL-6 (100 ng/mL) for 4 h, followed by LPS (250 ng/mL) and brefeldin A (5 μg/mL) for 2 h [healthy volunteers (circles), n = 4; patients with SIRS (squares), n = 5; patients with sepsis (triangles), n = 5]. Production of TNF-α by monocytes (FSCmed SSCmed CD45+ CD14+) was analysed by flow cytometry. The mean fluorescence intensity (MFI) of TNF-α is shown. Graphs represent individual data (each symbol represents data from one individual), mean and standard error of the mean. Data from healthy volunteers, patients with SIRS and patients with sepsis with the same treatment were analysed with Kruskal–Wallis test and Dunn’s multiple comparisons test. *P < 0.05, **P < 0.01.

