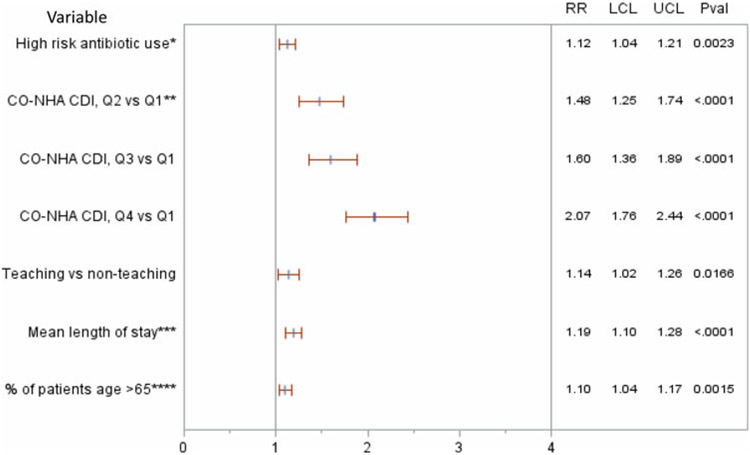
Fig. 3.
Multivariable Poisson model results. Note: *Per 1,000 days present, per increase of 100 days of therapy. **CO-NHA CDI: community-onset non–hospital-associated Clostridioides difficile infection. ***Per 1 day increase of mean length of stay. ****Per 10% increase of patient’s age >65 years. Note. Q1, first quartile; Q2, second quartile; Q3, third quartile; Q4, fourth quartile; RR, relative risk; LCL, lower confidence limit; UCL, upper confidence limit; Pval, P value.

