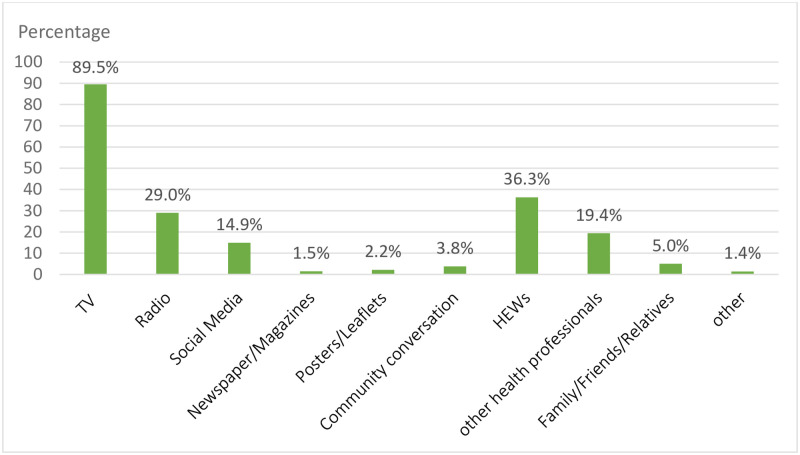
Fig 1. Sources of health information among study participants in Addis Ketema sub-city, Addis Ababa, Ethiopia, 2020.
The x-axis shows the different source of health information options and the y-axis shows the percentage given for each selected options. The green color shows the amount of percentage selected by participants for each sources of health information options. The total number of participants were 582.

