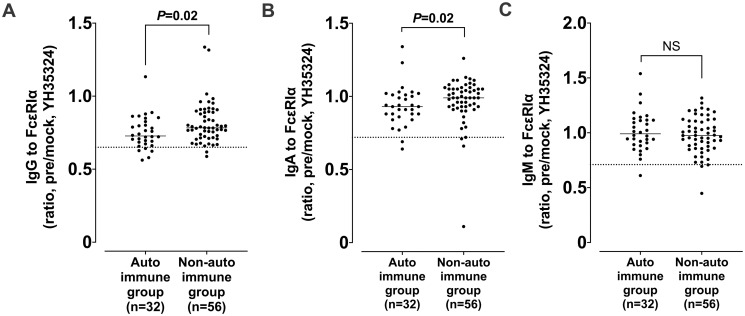
Fig 2. Comparisons of serum IgG/IgA/IgM levels to FcεRIα between the autoimmune and nonautoimmune groups.
The results were presented by the IgG ratio of YH35324-pretreated to mock-treated value (A), the IgA ratio of YH35324-pretreated to mock-treated value (B) and the IgM ratio of YH35324-pretreated to mock-treated value (C). The autoimmune group was defined if CSU patients have a positive result to ASST or ANA test. Horizontal lines and dotted lines show median values and cutoff values of each autoantibody FcεRIα respectively. P value was evaluated by Mann-Whitney test. ASST, autologous serum skin test; ANA, antinuclear antibody; NS, no statistical significance.

