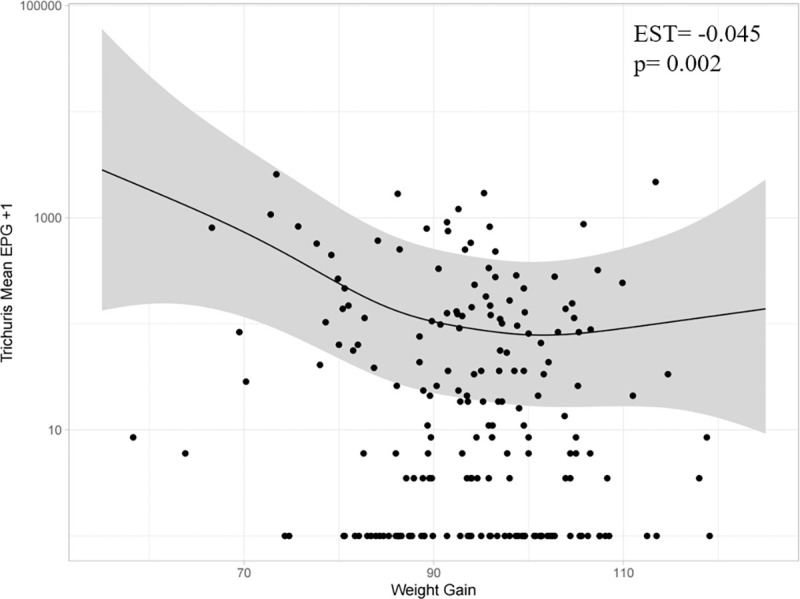
Fig 3. The relationship between Trichuris suis mean EPG (log scale) and weight gain (week 0–14) estimated using a generalised additive model (GAM) (n = 195).

The estimate is shown by solid black line and 95% CI are shown in grey shading. Individual data points have been overlaid for reference (black dots), with a constant of 1 added before log transformation for the purposes of visualization only. Inset are the estimate (EST) and p-value generated using a generalised linear mixed model (GLMM) assuming that the relationship is linear.
