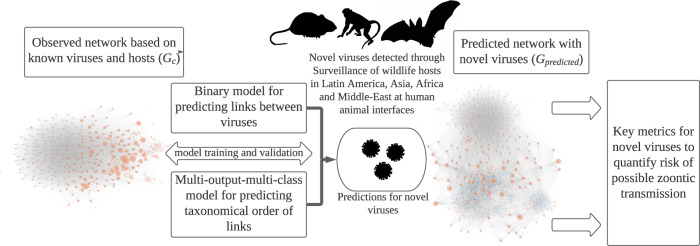
Fig. 1. Modeling workflow.
The figure shows the modeling procedure and methods implemented in the study. Orange dots represent a known virus in the observed () and predicted networks (), blue dots represent novel viruses in the predicted network (). Virus-host networks: , represents a unipartite observed network of known zoonotic and non-zoonotic viruses with nodes representing viruses and edges representing shared hosts. represents the predicted unipartite network generated after predicting possible linkages between 531 novel viruses (blue) and known viruses. The node size is proportional to the betweenness centrality.

