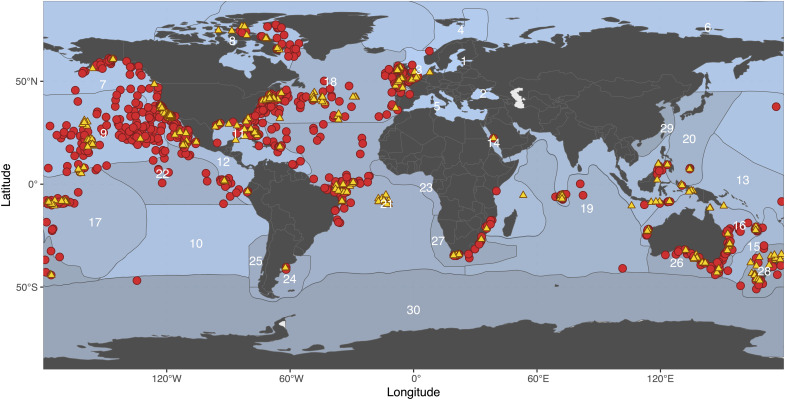
Fig. 1. Deployment and pop-up and/or recapture locations of tracked elasmobranchs.
Yellow triangles indicate deployment and red circles indicate pop-up and/or recapture of the 989 elasmobranchs included within the analysis for this study. Numbers refer to the ocean biogeographic realms as defined by Costello et al. (22) (see table S3). Pop-up locations were not available for 144 tags.

