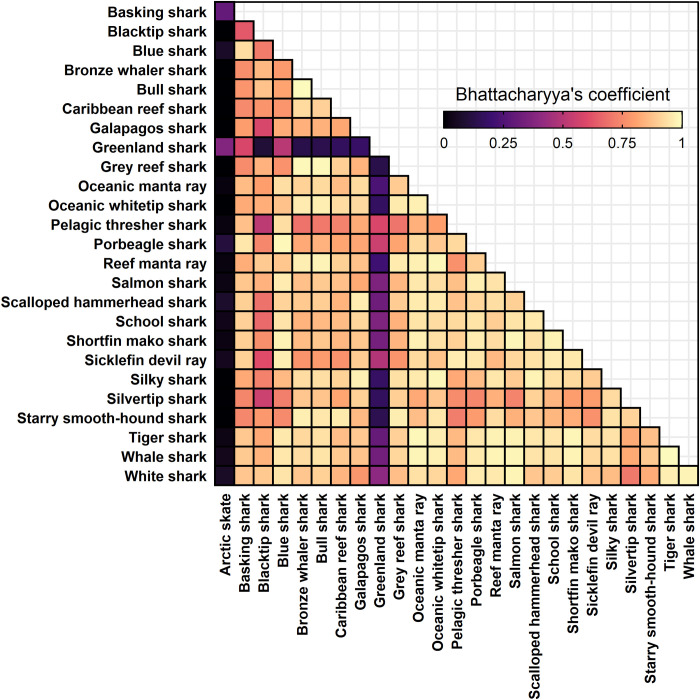
Fig. 4. Vertical habitat overlap between elasmobranch species.
Matrix of vertical habitat overlap (Bhattacharyya coefficient) among species, where zero indicates no overlap between depth distributions and one indicates identical depth distributions. Calculations were based on time-series depth data binned at 10-m intervals for each individual and averaged across a species. Only species with five or more individual depth time-series datasets were incorporated into this analysis (n = 26).

