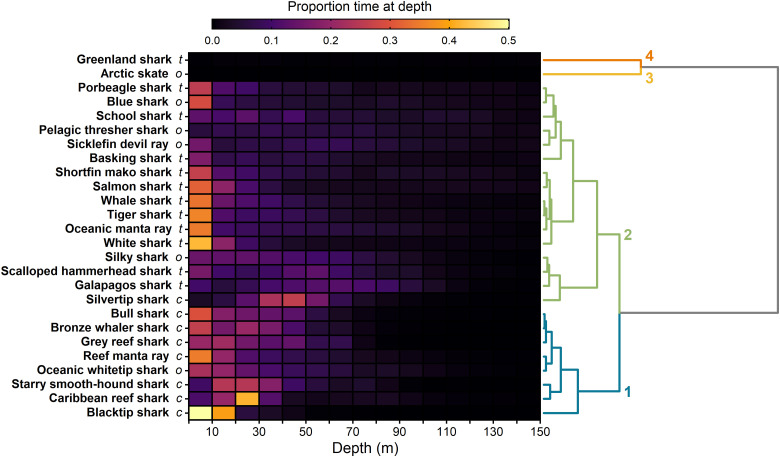
Fig. 5. Clustered depth distributions of elasmobranchs.
Depth distributions for 26 elasmobranch species with time-series data binned at 10-m intervals. Note that the plot has been limited to the top 150 m to ease interpretation but extends to 1850 m (see fig. S4 for the full plot). Italicized lettering next to each species name indicates the habitat type of each species (c = coastal, t = transient, and o = oceanic). The dendrogram and clusters on the right side of the figure resulted from hierarchical cluster analysis performed on dissimilarity of the Bhattacharyya coefficient. Numbered clusters represent species grouped according to similarity in vertical habitat use.

