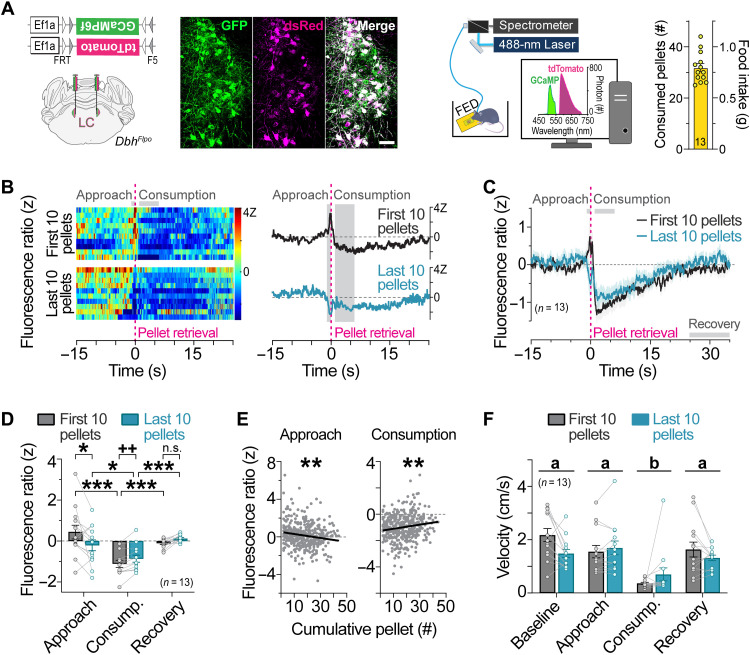
Fig. 1. LC-NE activity is increased during food approach and suppressed during feeding in a manner influenced by satiety.
(A) Left: Flp-dependent viral genetic strategy for coexpression of GCaMP6f and tdTomato (tdT) in LC-NE neurons. Middle: Coronal view of the locus coeruleus from an LCGCaMP/tdT mouse immunostained for GCaMP6f (GFP antibody) and tdT (dsRed antibody). Scale bar, 50 μm. Right: Schematic of in vivo fiber photometry setup and feeding experimentation device (FED). Average food intake across the 1-hour session. Data are means ± SEM. n = 13 LCGCaMP/tdT mice. (B) Fluorescence ratio expressed as a z score aligned to pellet retrieval during the first 10 pellets (top) and last 10 pellets (bottom) of the session from a representative fasted LCGCaMP/tdT mouse. Single trials are represented in the heatmap (left), and average z-score fluorescence ratio is represented in the trace (right). (C) Average z-score fluorescence ratio aligned to pellet retrieval in fasted LCGCaMP/tdT mice during the first 10 pellets and last 10 pellets of the session. Data are means ± SEM. n = 13 LCGCaMP/tdT mice. (D) Average z-score fluorescence ratio during feeding-related behaviors. Two-way repeated-measures ANOVA, satiety × behavior interaction: F2,24 = 8.819, P = 0.0013. Bonferroni post hoc test, ***P < 0.001 and *P < 0.05. n.s., nonsignificant. Paired sample t test: t12 = 3.807, ++P < 0.01. Data are means ± SEM. n = 13 LCGCaMP/tdT mice. (E) Linear regression of the average z-score fluorescence ratio during food approach and consumption in relation to pellet events across the sessions of fasted LCGCaMP/tdT mice. Approach (slope = −0.02126 ± 0.006555; R2 = 0.02569; F1,399 = 10.52, **P < 0.01) and consumption (slope = 0.01562 ± 0.004806; R2 = 0.02579; F1,399 = 10.56, **P < 0.01). (F) Average velocity during feeding-related behaviors. Two-way repeated-measures ANOVA, main effect of behavior: F3,36 = 26.9, P < 0.001, satiety × behavior interaction: F3,36 = 4.457, P = 0.0092. Bonferroni post hoc test, P < 0.001 consumption (group b) versus all other behavioral states (group a). Data are means ± SEM. n = 13 LCGCaMP/tdT mice.

