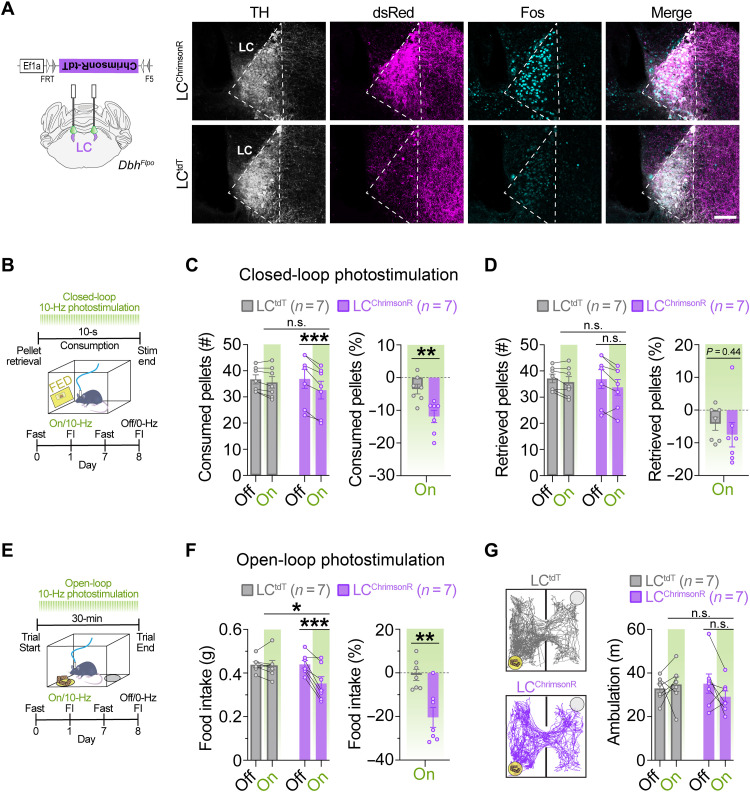
Fig. 3. Optogenetic stimulation of LC-NE cell bodies suppresses feeding.
(A) Left: Schematic of coronal mouse brain showing location of Flp-dependent AAV to drive ChrimsonR-tdT expression. Right: Immunofluorescent labeling of Fos (turquoise) in noradrenergic (TH, light gray), tdT-expressing (dsRed, magenta) locus coeruleus neurons in coronal brain sections from a representative LCtdT and LCChrimsonR mouse following photostimulation (560 nm, 10 Hz, 10 ms) for 30 min. Scale bar, 100 μm. (B) Timeline of closed-loop optogenetic experiment wherein photostimulation (10 Hz) was triggered upon pellet retrieval and occurred briefly for 10 s during consumption from the FED. (C and D) Left: Average feeding behavior of fasted mice during closed-loop optogenetic experiment. Two-way repeated-measures ANOVA, stimulation × virus interaction: number of pellets consumed (C; F1,12 = 13.70, P = 0.0030) and pellets retrieved (D; F1,12 = 1.571, P = 0.2339). Bonferroni post hoc test, ***P < 0.001 and **P < 0.01. Data are means ± SEM. n = 7 LCtdT mice, n = 7 LCChrimsonR mice. Right: Feeding behavior during closed-loop photostimulation <<(On) as percent change from no stimulation (Off) in fasted mice. Unpaired sample t test: percent change in pellets consumed (C; t12 = 3.504, **P < 0.01) and pellets retrieved (D; t12 = 0.7904, P = 0.4446). (E) Timeline of food intake (FI) during open-loop photostimulation (10 Hz, 10-ms pulses). (F) Left: Average 30-min food intake during the presence (On) or absence (Off) of open-loop photostimulation in fasted mice. Two-way repeated-measures ANOVA, stimulation × virus interaction: F1,12 = 14.42, P = 0.0025. Bonferroni post hoc test, ***P < 0.001, **P < 0.01, and *P < 0.05. Right: Food intake during photostimulation as percent change from no photostimulation. Unpaired sample t test, t12 = 3.716, **P < 0.01. (G) Ambulation in FI task during open-loop photostimulation. Left: Representative traces show ambulation, yellow circle indicates food cup location, and gray circle indicates empty cup location. Right: Average ambulation in FI task in fasted mice. Two-way repeated-measures ANOVA, stimulation × virus interaction: F1,12 = 2.149, P = 0.1684. Data are means ± SEM. n = 7 LCtdT mice and n = 7 LCChrimsonR mice.

