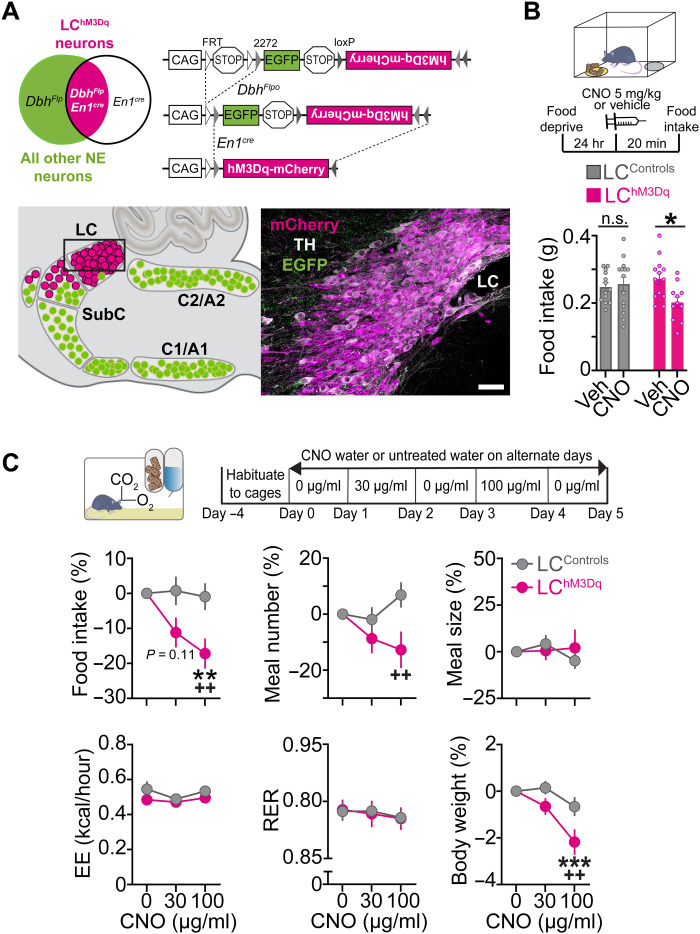
Fig. 4. Chemogenetic activation of LC-NE neurons suppresses feeding without altering metabolism.
(A) Left: Schematic illustration of intersectional genetic strategy. Recombination of RC::FL-hM3Dq allele by DbhFlpo and En1cre results in hM3Dq-mCherry expression in LC-NE neurons. Recombination by DbhFlpo alone leads to EGFP expression. Right: Schematic of sagittal mouse hindbrain compressed across the mediolateral axis. Parasagittal section from LChM3Dq brain reveals hM3Dq-mCherry expression in LC-NE neurons. Scale bar, 50 μm. (B) Top: Timeline of FI experiments in fasted mice. Bottom: Average FI in fasted mice. Two-way between-subject ANOVA, drug × genotype interaction: F1,47 = 5.20, P = 0.0272. Bonferroni post hoc test, *P < 0.05. Data are means ± SEM. n = 13 vehicle-treated and n = 14 CNO-treated LCControls. n = 13 vehicle-treated LChM3Dq mice, n = 11 CNO-treated LChM3Dq mice. (C) Top: Timeline of CNO water at 30 and 100 μg/ml. Bottom: Behavioral and metabolic measures in the automated homecage. Two-way repeated-measures ANOVA, drug × genotype interaction: food intake (F2,54 = 3.64, P = 0.0329), meal number (F2,54 = 3.478, P = 0.0379), meal size (F2,54 = 0.8542, P = 0.4313), energy expenditure (EE; F2,54 = 0.4781, P = 0.6226), respiratory exchange rate (RER; F2,54 = 0.04714, P = 0.9540), and body weight (F2,70 = 3.647, P = 0.0312). Bonferroni post hoc test, ***P < 0.001 and **P < 0.01 versus vehicle; ++P < 0.01 versus LCControls. Data are means ± SEM. n = 20 LCControls and n = 9 LChM3Dq mice for all measures except body weight wherein n = 17 LChM3Dq mice.

